


California! [And Kansas, Rhode Island and South Dakota]

Today we present the ELA (English language arts) and math test score results from California, Kansas, Rhode Island, and South Dakota. Each of these states released its 2023 results within the past week.
Below, we present an overview of how states are progressing in the recent post-pandemic era. If you’d like to see the full set of results, PDFs are accessible here. The new state PDFs are linked below.
California is the largest state releasing data this week; it was among the states with the longest school closures during the COVID-19 pandemic. Despite this, its initial declines in proficiency rates between 2019 and 2022 were in the middle of the distribution (California did not test universally in 2021). However, this still meant a 4.3 percentage point drop in ELA proficiency and 6.5 percentage points in math between 2019 and 2022.
California made minimal progress between 2022 and 2023. The state’s overall proficiency in ELA fell slightly from 2022, though there was some recovery in math. These changes can be seen in the figures below. As in most other states, proficiency levels vary considerably across race/ethnicity and income groups. For example, only 18% of Black students in California tested proficient in math in 2023, versus 51% of white students and 71% of Asian students. However, student proficiency in math in 2023 is lower than in 2019 across all race/ethnicity and income groups.
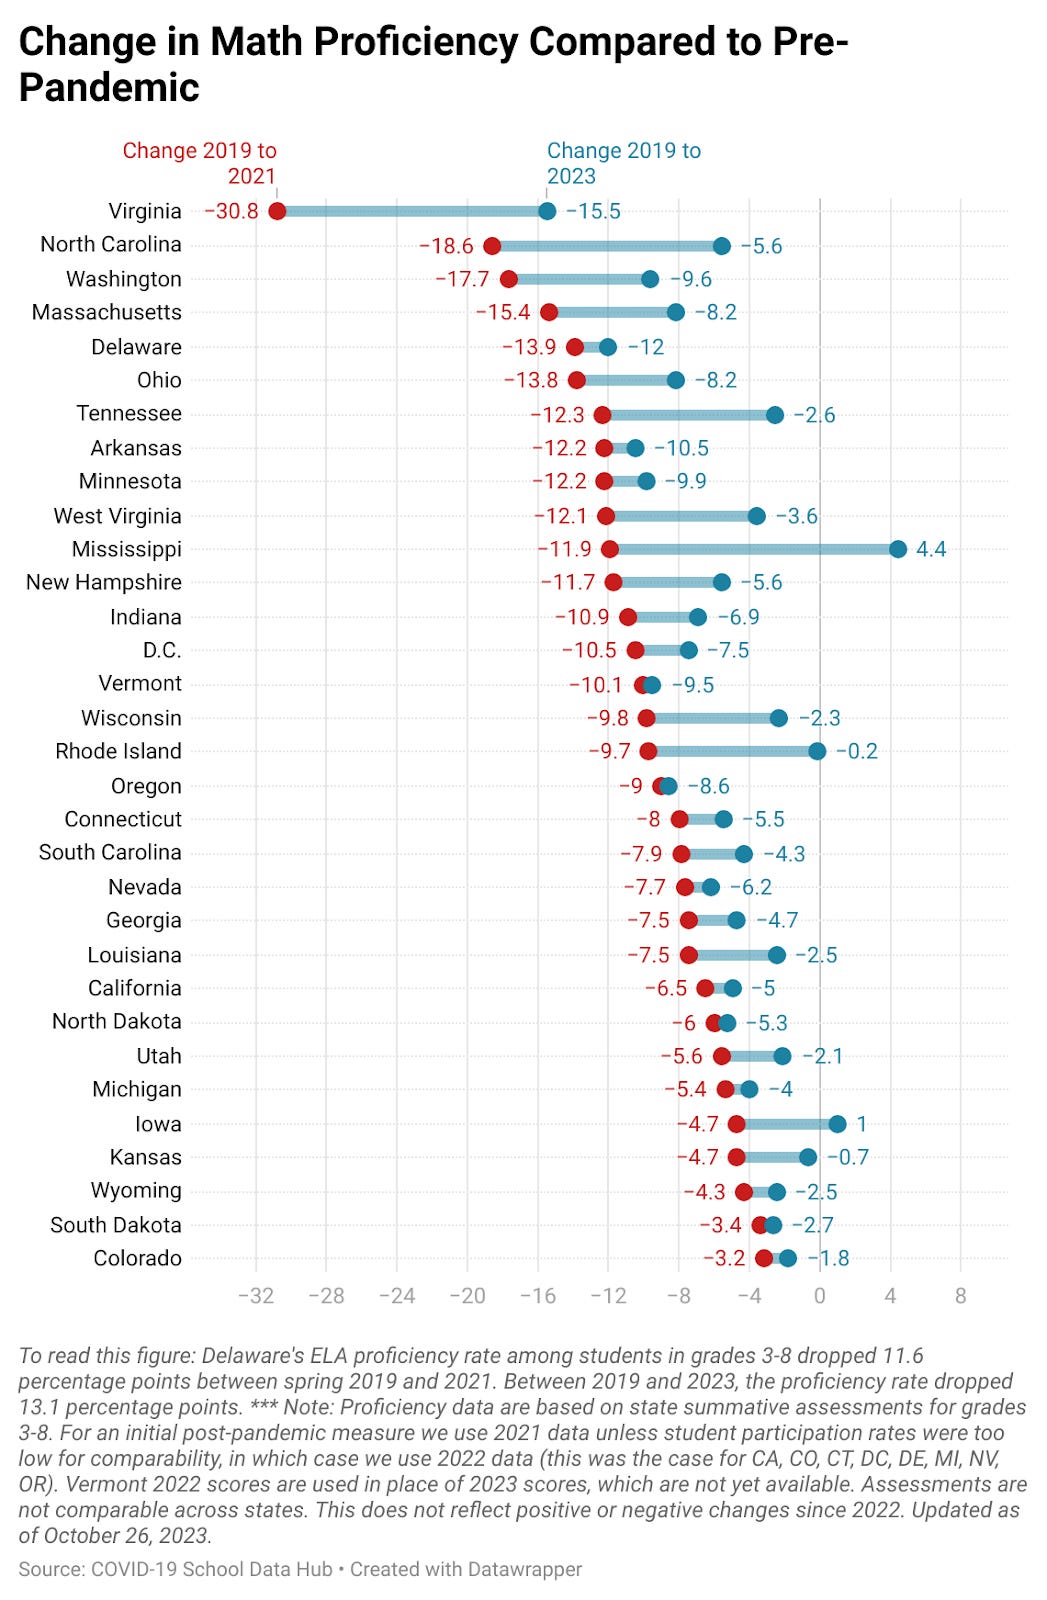
Overall Changes Compared with Pre-Pandemic
The figures below illustrate declines during COVID and recovery post-pandemic. For each state, we illustrate the change in proficiency rates from 2019 to 2021 (red), along with the change from 2019 to 2023 (blue).

Classifications
The tables below classify states in broader categories, based on their recovery in both ELA and math:
Continued Decline: States that have continued to see test scores decline in the post-pandemic period
Minimal Change: States that have seen little recovery in the post-pandemic period (less than 1% change)
Making Progress: States that are making steady progress (more than 1% change) but have not yet recovered to 2019 proficiency rates
Recovered or Exceeding: States that have recovered to or are now exceeding their 2019 proficiency rates
These tables help display the distinct recovery patterns between ELA and math.


If you are interested in other information out of these data — other analyses, data cuts, or visualizations — please reach out and we’ll see if we can help. We’ve only scratched the surface here, and a main goal of our work is to make these data more accessible to people who want to write about, analyze, or use them in their work. You can email us at statetestscoreresults@gmail.com or leave a comment below.