


Connecticut: 2024 Assessment Results
Minimal ELA change since 2021; steady progress in math

Overview
Here at the 2024 State Assessment Data Substack, we’ll be releasing these posts as states release their data (and we clean it). To keep it brief, every post will have three sets of graphs: 1) math and ELA test scores for grades 3-8 over time, 2) math and ELA scores by race/ethnicity, and 3) outcomes by economic status, when possible.
Our intention here is to give you the big picture: where are the state scores going, and how does that differ by group. These graphs are made with Zelma.ai, and if you want to explore up through the 2023 data yourself, you can do that here. All available 2024 assessment data will be published in December. You can read more about Zelma in our post here.
Tomorrow, we will share a summary of the states we have reported on thus far, including a look at their initial learning loss as well as their recovery in both ELA and math.
Today: Connecticut.
State Assessment Background
Connecticut’s student outcome data come from the state’s Smarter Balanced assessments. The results below reflect student proficiency levels in grades 3–8 in math and ELA between 2015-2024. Note that in Spring 2021, the U.S. Department of Education waived the requirement that 95% of all students complete the state’s annual academic assessment, leading to varied participation rates by state. In Connecticut, participation varied across districts and schools in that year, so results should be viewed with this in mind.
Overall Trends
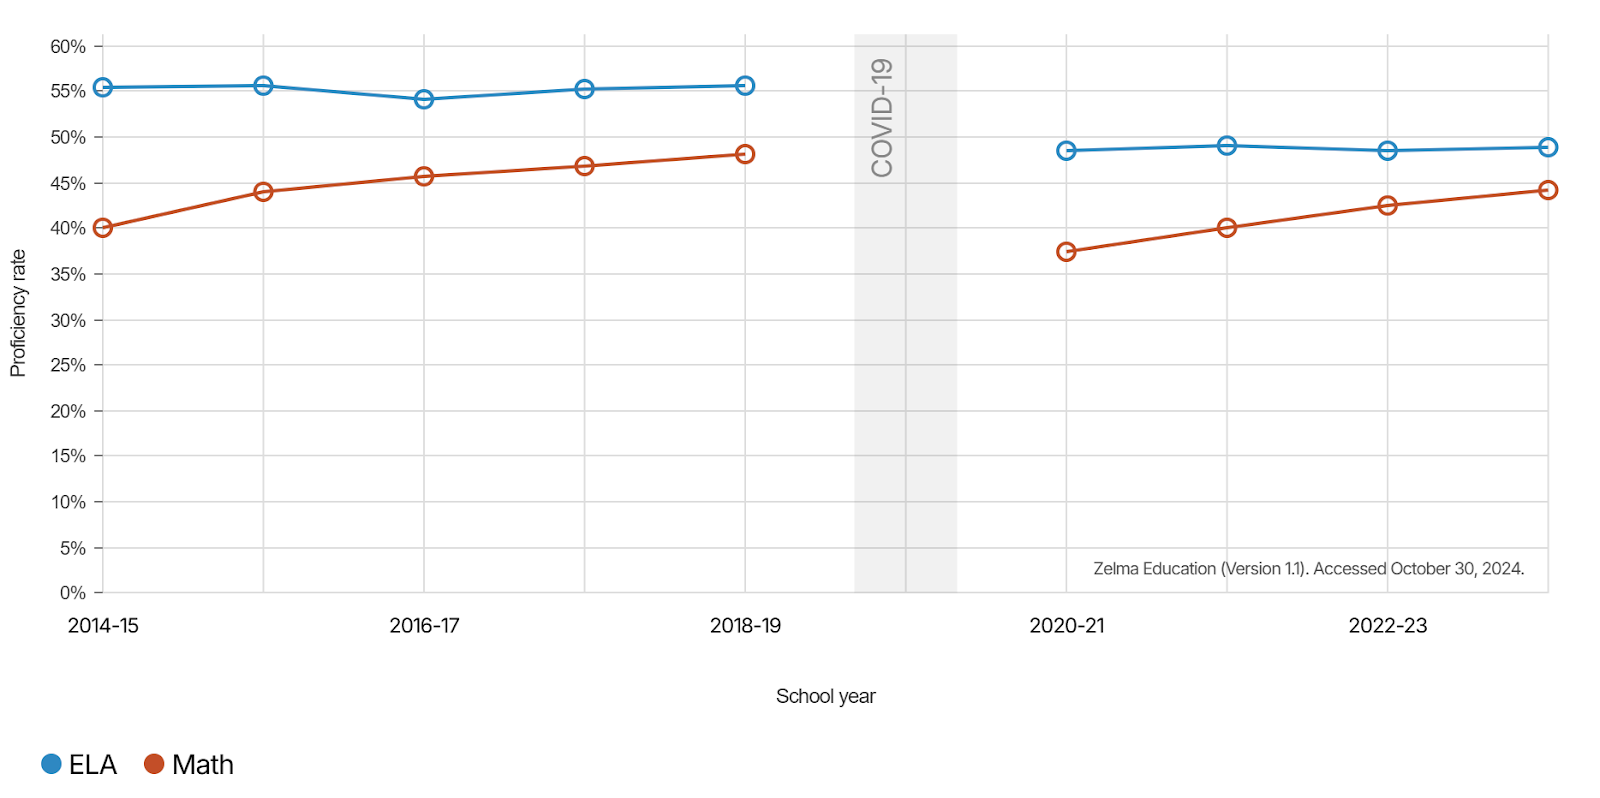
Compared to 2023, Connecticut’s overall proficiency rates in 2024 for students in grades 3–8 remain below pre-pandemic levels. ELA outcomes have remained largely unchanged in ELA since 2021, while math has been steadily improving during that time.
ELA: Proficiency rates rose slightly from 48% to 49% between 2023 and 2024, compared to 56% in 2019.
Math: Proficiency rates rose from 42% to 44% between 2023 and 2024, short of 2019 rates of 48%.
Overall ELA & Math Results, Grades 3–8
Trends by Race and Ethnicity
ELA Results by Race/Ethnicity, Grades 3–8

Math Results by Race/Ethnicity, Grades 3–8

Trends by Economic Status
ELA Results by Economic Status, Grades 3–8

Math Results by Economic Status, Grades 3–8
