


Connecticut, Minnesota, South Carolina

Today’s edition of this newsletter reports on ELA and math assessment test score changes during and after the pandemic from Connecticut, Minnesota, and South Carolina. Each of these states has recently released their 2023 assessment data.
Quick Recap
Across state briefs, we present the change in ELA (English language arts) and math scores for grades 3 through 8, and we’ll provide the same three graphs for each state:
Overall proficiency rates in ELA and math, going back to 2018 if possible
Proficiency rates in ELA and math by race/ethnicity
Proficiency rates in ELA and math by district-level poverty rate
We’re touching on just the overall rates of recovery for each of these states today. You can see breakdowns by race and poverty rate (as available) in the full PDFs, accessible here for all states.
Now let’s dive in.
Post-Pandemic Proficiency: Continued Decline to Full Recovery
To date, 12 states have released 2023 data on test scores. All states lost ground on academic achievement during the pandemic, which was primarily evident in lower test scores in spring 2021 compared with spring 2019. We are now able to see two years of post-pandemic recovery in many of these states.
To provide an overall summary, we have divided these states into four categories in both ELA and math:
Continued Decline: States that have continued to see test scores decline in the post-pandemic period
Minimal Change: States that have seen little recovery in the post-pandemic period (less than 1% change)
Making Progress: States that are making steady progress but have not yet recovered to 2019 proficiency rates
Recovered or Exceeding: States that have recovered to or are now exceeding their 2019 proficiency rates


Recent State Release
Connecticut
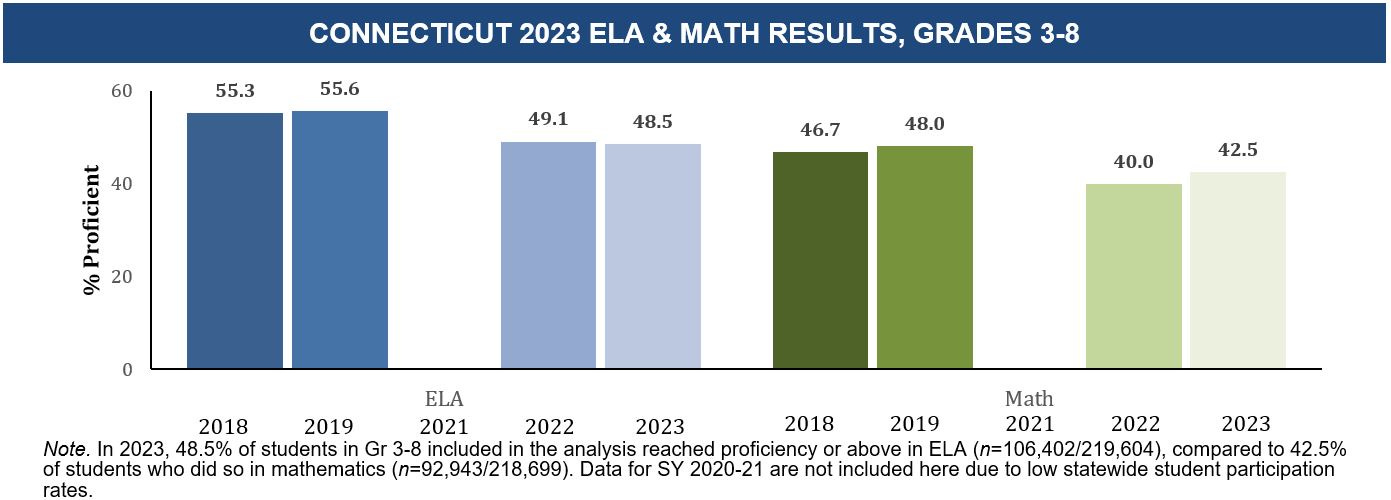
The student outcome data used in this data brief come from the state’s Smarter Balanced Assessments; more information can be found here. In the summaries below, we define proficiency as students achieving Level 3 (Meets the Achievement Level) and Level 4 (Exceeds the Achievement Level). We use test scores from 2022 as our first post-pandemic measure given lower participation rates in 2021 in Connecticut.
Between 2019 and 2022, overall proficiency rates in Connecticut fell about 6.5 percentage points in ELA and 8.0 percentage points in math.
State test scores in Connecticut have shown some recovery in math, rising slightly from 2022 to 2023, but remain below pre-pandemic levels. In ELA, however, scores have actually continued to decline between 2022 and 2023 — they are now down 7.1 percentage points from 2019.
Minnesota
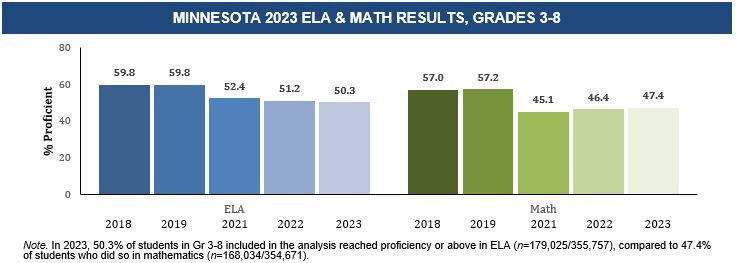
The student outcome data used in this data brief come from the Minnesota Comprehensive Assessments (MCAs) and the state’s alternative assessment, the Minnesota Test of Academic Skills (MTAS); more information can be found here. The state’s assessments include four proficiency levels: Does Not Meet Standards, Partially Meets Standards, Meets Standards, and Exceeds Standards. In the summaries below, we define proficiency as students in the top two proficiency levels.
Overall proficiency in Minnesota fell in both ELA and math during the pandemic between 2019 and 2021, falling about 7.4 percentage points in ELA and 12.1 percentage points in math.
State test scores in Minnesota have shown very limited recovery since 2021. Math scores have risen slightly between 2021 and 2023 (rising 2.3pp) but remain significantly below 2019 levels (47.4% proficient in 2023 compared with 57.2% in 2019). In ELA, scores have actually further declined in both 2022 and 2023 and remain below 2019 levels of proficiency.
South Carolina
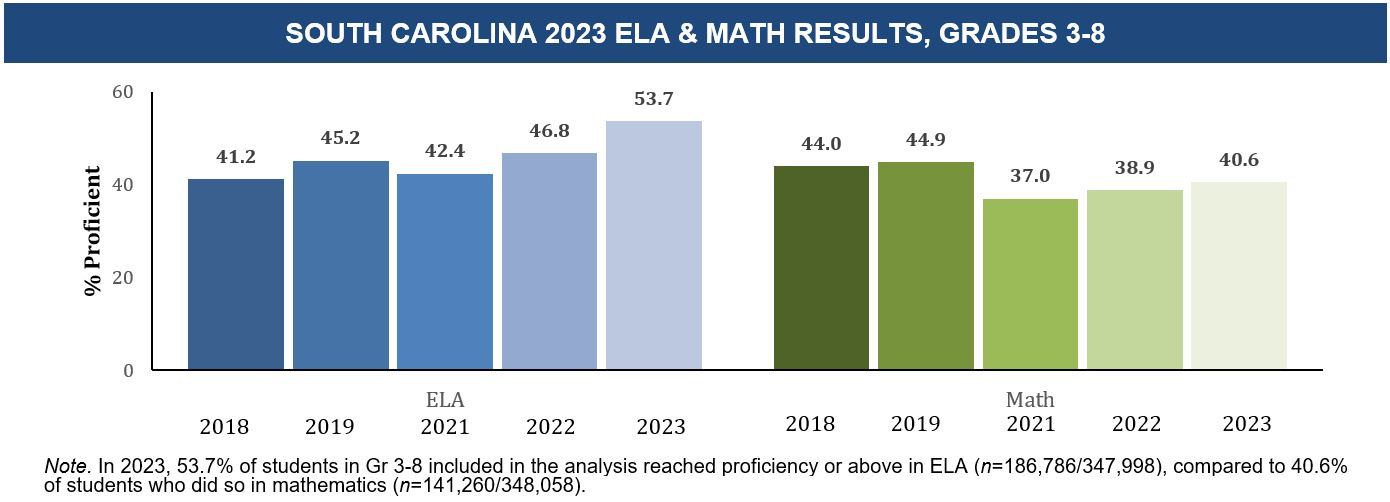
The student outcome data used in this data brief come from the SC READY assessment; more information can be found here. The state’s assessments include four proficiency levels: Does Not Meet Expectations, Approaches Expectations, Meets Expectations, and Exceeds Expectations. In the summaries below, we define proficiency as students in the top two proficiency levels.
In South Carolina, proficiency rates in both ELA and math fell during the pandemic, dropping about 2.8 percentage points in ELA and 7.9 percentage points in math.
However, test scores have risen in both subjects since 2021, with ELA scores actually surpassing pre-pandemic rates: about 54% of students are proficient in ELA in 2023, compared with 45% prior to the pandemic. Students have made gains in raising math scores but the state has not yet reached pre-pandemic rates of proficiency.
A Final Word:
If you are interested in other information out of these data — other analyses, data cuts, or visualizations — please reach out and we’ll see if we can help. We’ve only scratched the surface here, and a main goal of our work is to make these data more accessible to people who want to write about, analyze, or use them in their work. You can email us at statetestscoreresults@gmail.com or leave a comment below.