2025 State Test Score Results Data Series
Welcome! This newsletter is published by the Education Data Center and is designed to provide updates on 2025 state assessment data. We’re sharing high-level insights on ELA and math state summative assessment outcomes for students in grades 3-8. You can expect to find the following for each state:
Overall ELA and math achievement trends;
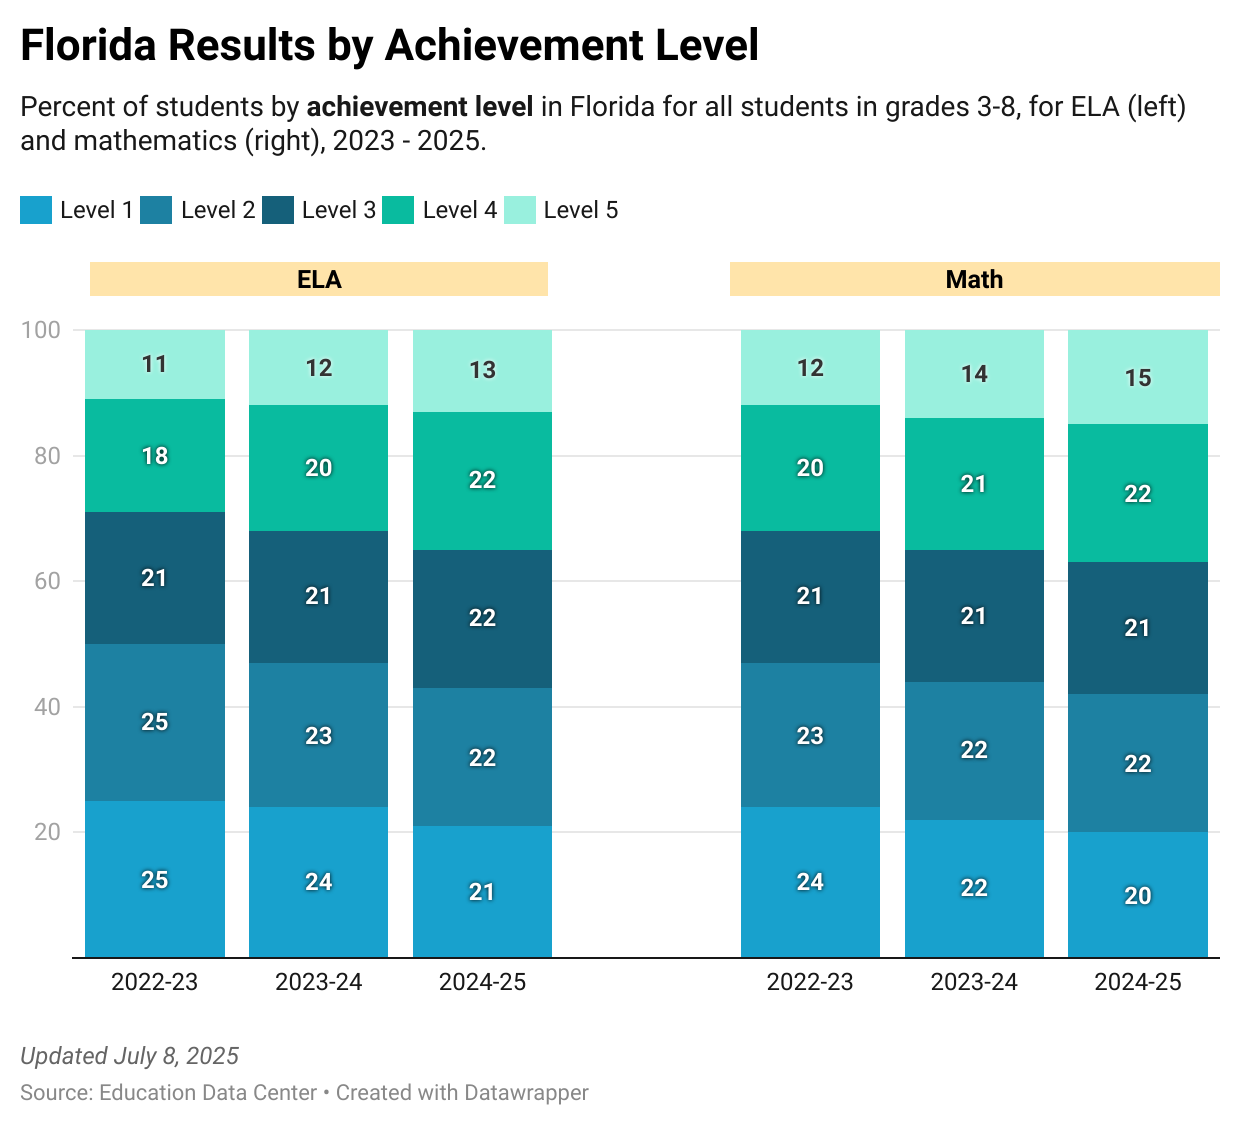
ELA and math results disaggregated by achievement level;
Maps of ELA and math results by district in 2025;
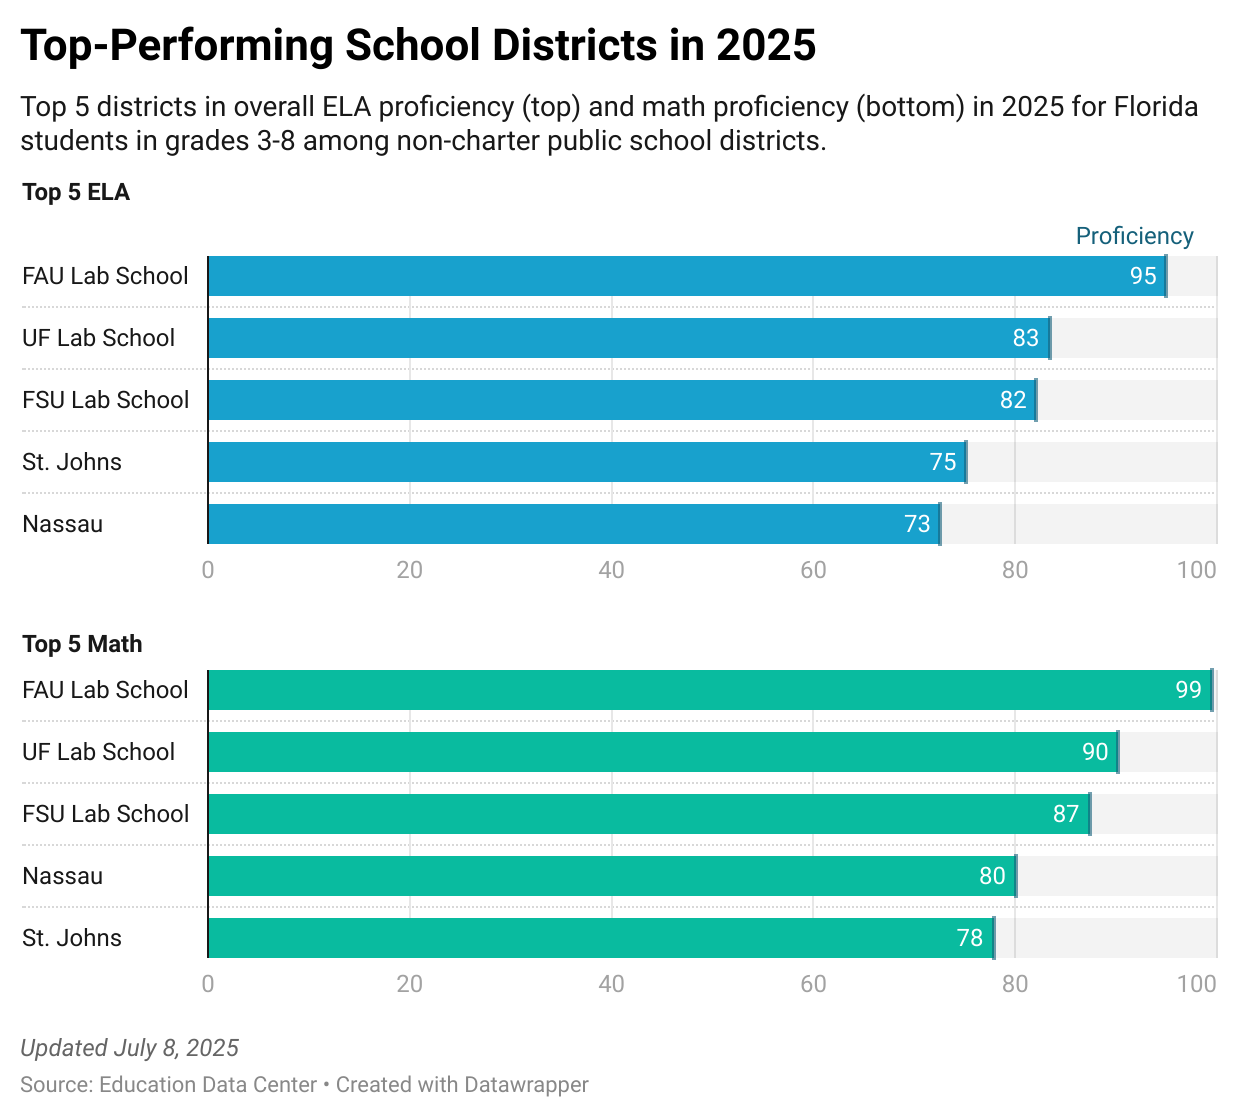
Top-performing school districts in ELA and math in 2025; and
ELA and math results by race/ethnicity in 2025.
We have included additional information about the state assessment at the end of this post, for reference. All available 2025 assessment data will be published by the EDC in December.
Today we present results from Florida - our first post of the 2025 State Test Score Results Data Series.
Trends Over Time
Overall 2025 proficiency rates for students in grades 3–8 remain climbed in both ELA and math compared to 2024 and 2023 (baseline year).
ELA: Proficiency rates rose to approximately 57% in 2025, up from 53% in 2024.
Math: Proficiency rates rose to approximately 59% in 2025, up from 56% in 2024.
Figure 1. ELA and Math Achievement Trends
Figure 2. Florida Results by Achievement Level
A Closer Look at 2025
Figure 3. 2025 ELA Proficiency by School District
Figure 4. 2025 Math Proficiency by School District
Florida School District Spotlight
Figure 5. Top-Performing School Districts in 2025 in ELA and Math
Results by Race/Ethnicity in 2025
Figure 6. ELA: Top Performing Florida Districts
Florida State Assessment Background
The state assessment data used for this summary represent ELA and math outcomes for students in Grades 3-8 only.
Assessment Name: Florida Assessment of Student Thinking (FAST)
Years Included in Analysis: 2023 - 2025. Florida administered the FAST to students in grades 3–8 for the first time in 2023.
Additional Information: More information on the FAST assessments can be found at https://www.fldoe.org/accountability/assessments/k-12-student-assessment/best/.
Data presented here are specific to this state’s assessment and are not comparable to assessments administered by other states. For questions, please reach out to info@eddatacenter.org.
Please subscribe or share with a friend or colleague who may be interested in this data!


Can you help me understand the top performing school districts section? UF and FSU Lab Schools aren't districts but two single K-12 schools. And while they aren't technically charter schools, there is still an application process, possibly limited bus transportation (The same characteristics that might skew charter data). I'd be interested to see how the data shakes out without lab schools!