

Hawaii & Missouri. And Better Data Access!
Hawaii & Missouri. And Better Data Access!
Happy Leap Day!

Happy Leap Year Day!
In today’s post, we present 2023 assessment data from two new states: Hawaii and Missouri.
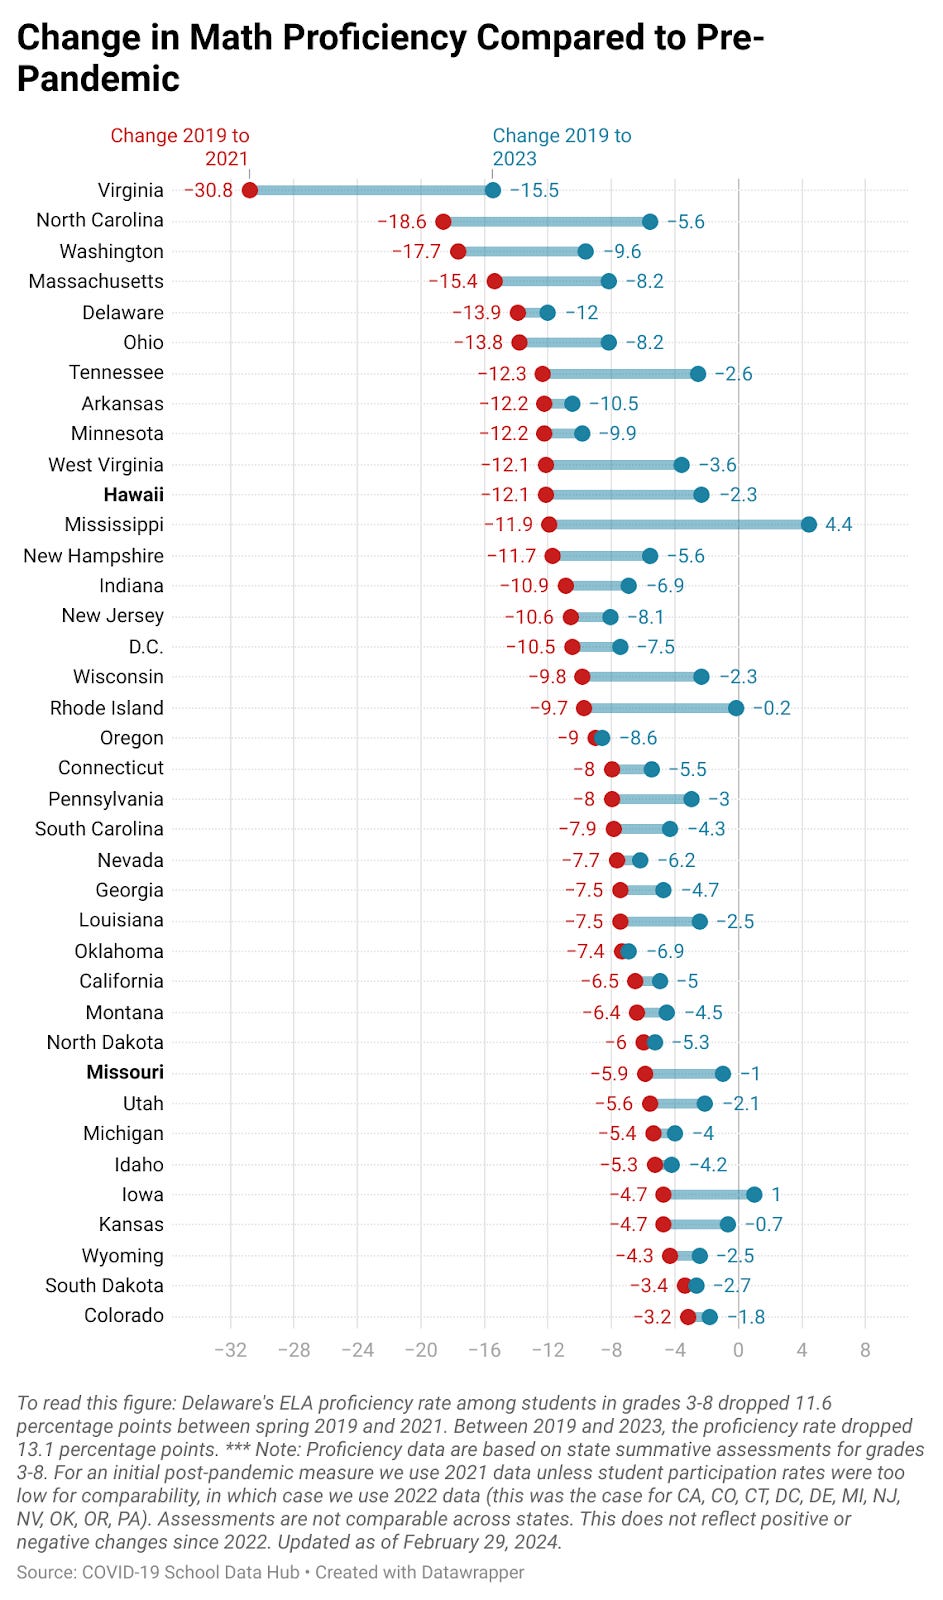
Hawaii and Missouri are both making progress in math, though neither state has fully recovered to pre-pandemic proficiency rates. This trend is consistent with the majority of states we have tracked over the past few months: on the whole, states are making steady progress toward pre-pandemic proficiency levels, though few have reached or surpassed levels from 2019.
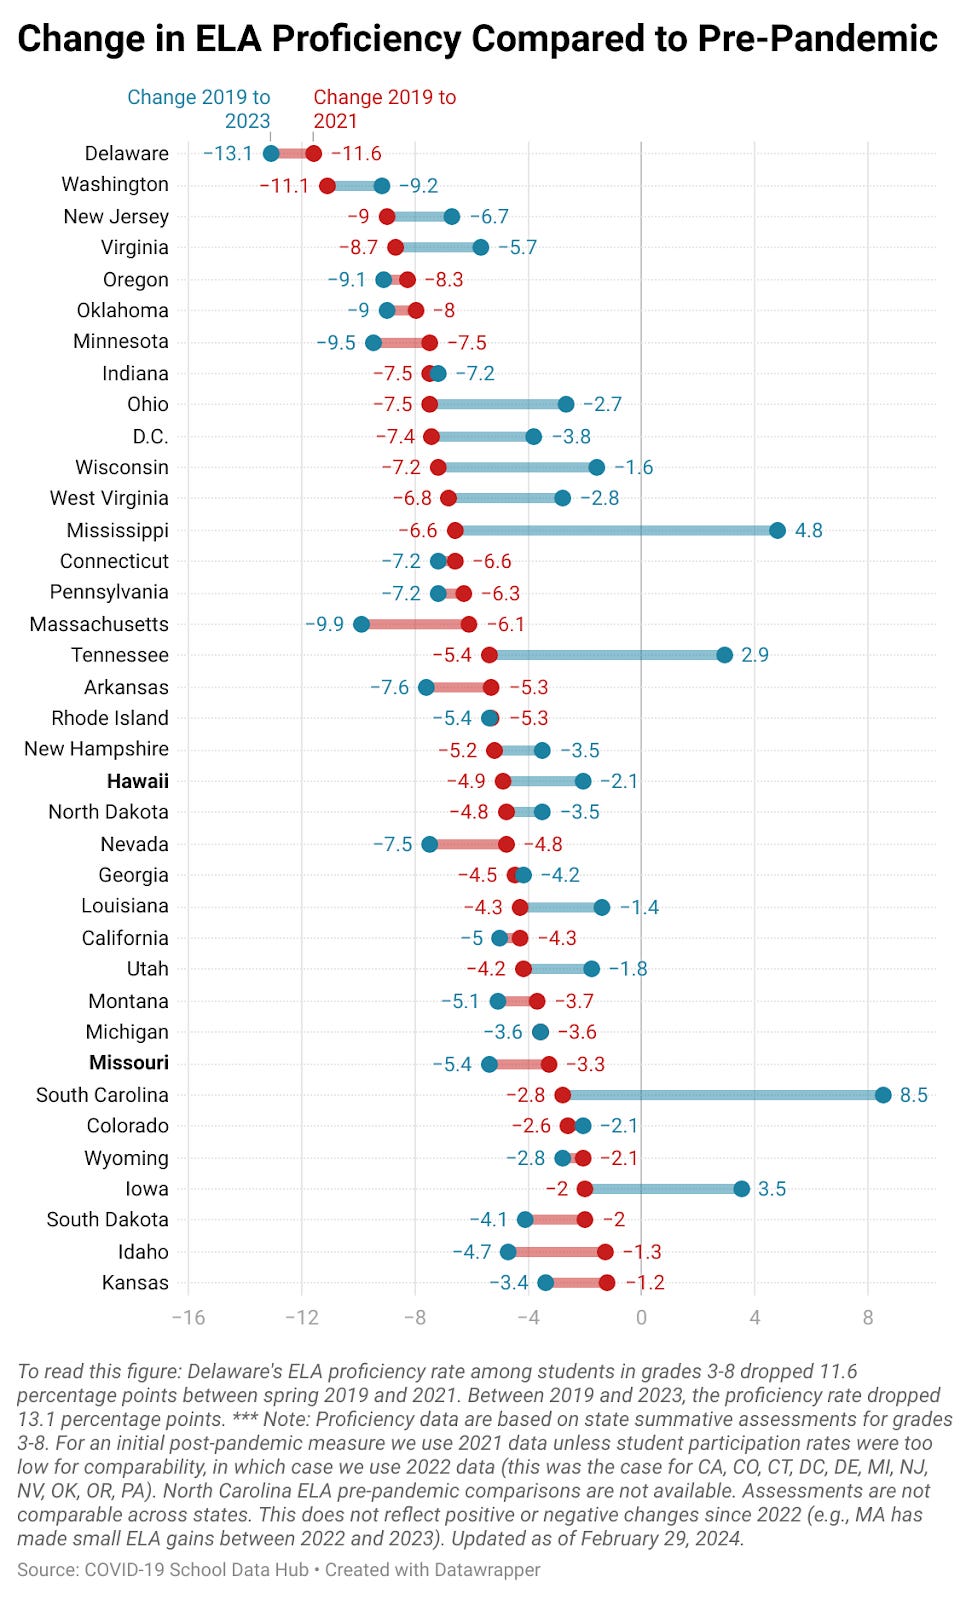
On the other hand, in ELA, Missouri has had some continued declines in achievement in 2023 compared to 2021. For students in grades 3-8, approximately 44% of students in Missouri were proficient in 2021, compared to 42% in 2023. Hawaii has been making progress toward pre-pandemic achievement rates (rising from 48% to 51% from 2021 to 2023), though the state has not fully recovered.
A note on Zelma.ai
To everyone who subscribes here who has utilized our newest AI data tool to explore state assessment data at Zelma.ai, we wanted to let you know we have made it easier for research partners to download the whole dataset and to be kept updated when we add new data. To take advantage of this, please go here and click "Access Full Dataset". You can provide us with your email for updates, and you'll get access to the full dataset by email, including detailed technical documentation.
Zelma has all of the data we’re using to produce these briefs, plus you can ask for data by school or district (make sure to specify the state!), race/ethnicity, economic status, and more. You ask questions in natural language, and Zelma will produce graphs and tables to display the results. You can read more about it here.
Overall Changes Compared with Pre-Pandemic
The figures below illustrate declines during COVID and recovery post-pandemic. For each state, we illustrate the change in proficiency rates from 2019 to 2021 (red), along with the change from 2019 to 2023 (blue). The two new states since our last post are in bold in the figures.
Classifications
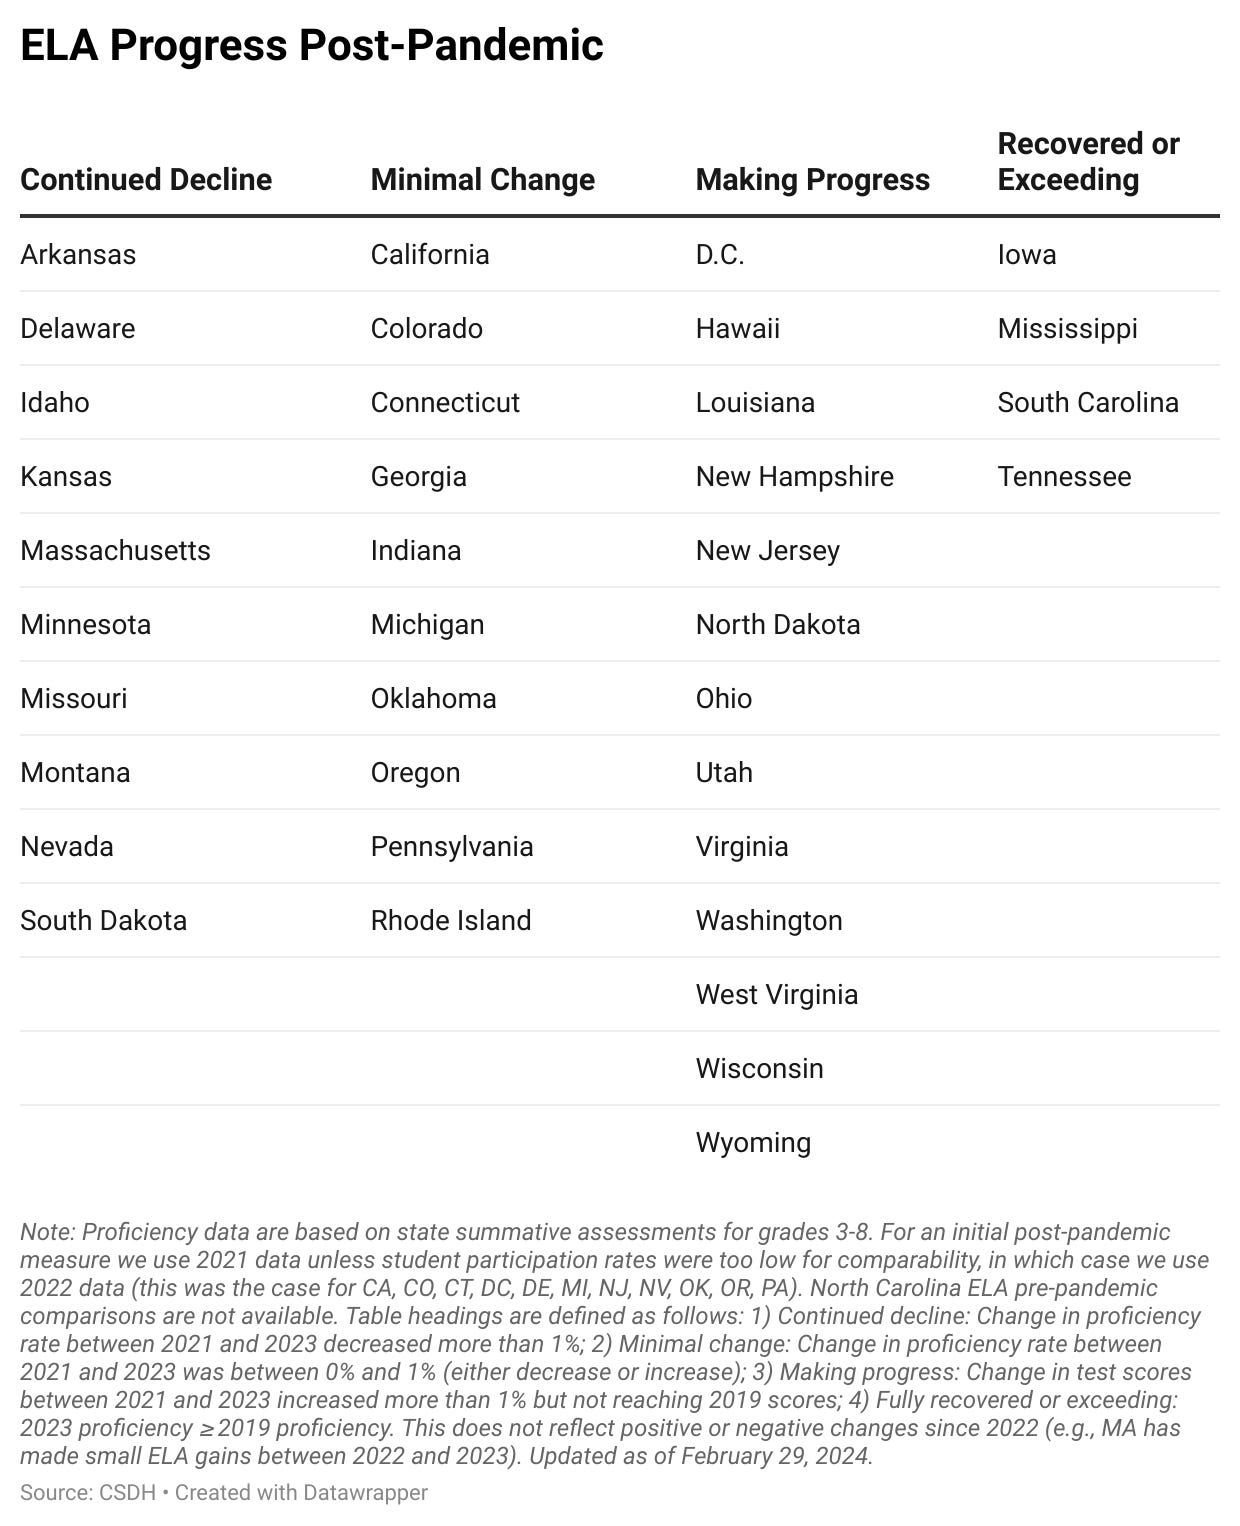
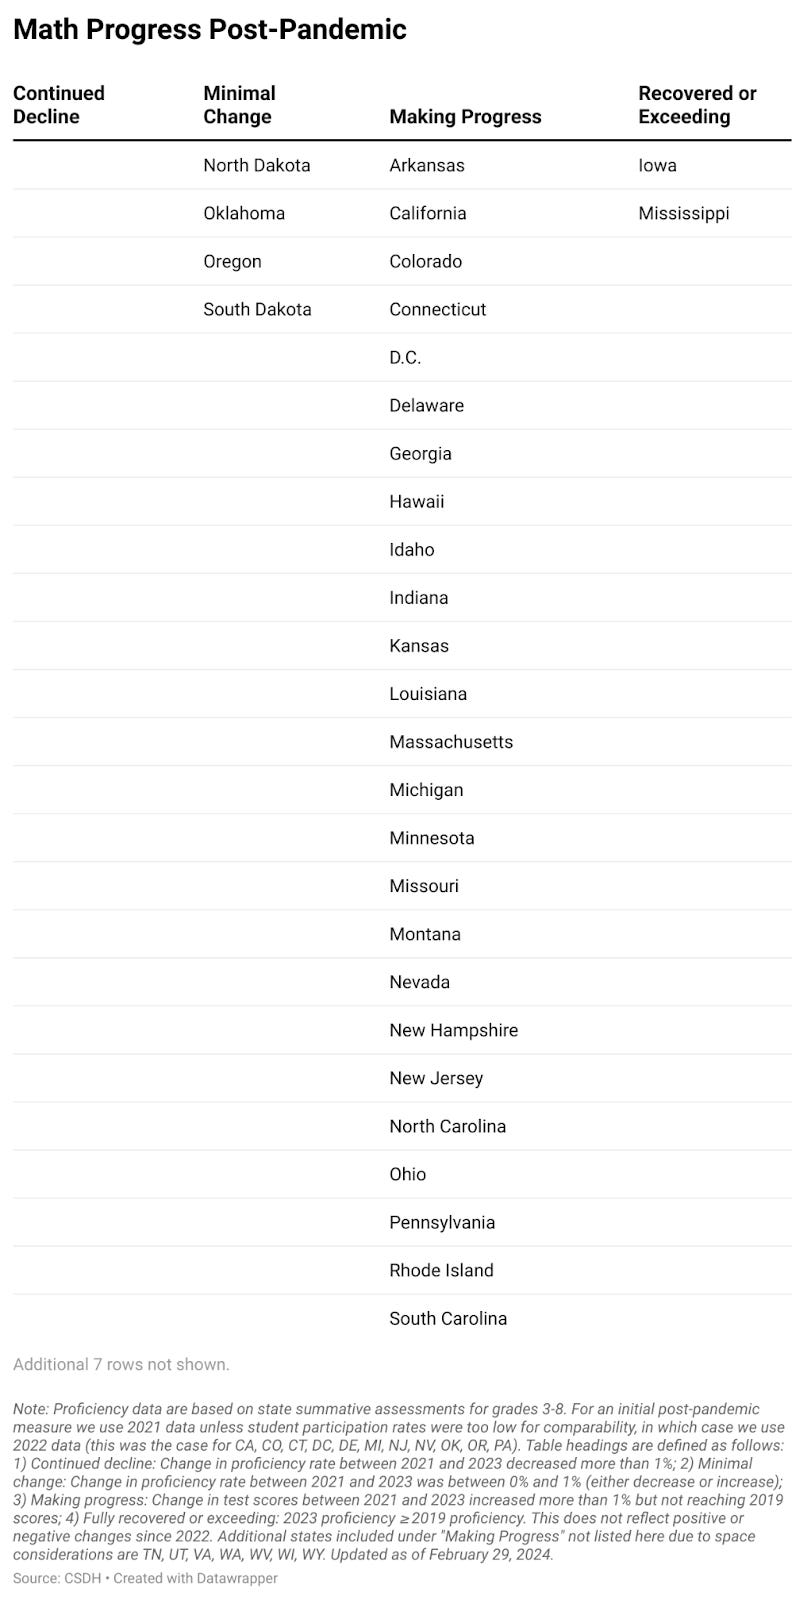
The tables below classify states in broader categories, based on their recovery in both ELA and math:
Continued Decline: States that have continued to see test scores decline in the post-pandemic period
Minimal Change: States that have seen little recovery in the post-pandemic period (less than 1% change)
Making Progress: States that are making steady progress (more than 1% change) but have not yet recovered to 2019 proficiency rates
Recovered or Exceeding: States that have recovered to or are now exceeding their 2019 proficiency rates
These tables help display the distinct recovery patterns between ELA and math.
If you are interested in other information out of these data — other analyses, data cuts, or visualizations — please reach out and we’ll see if we can help. We’ve only scratched the surface here, and a main goal of our work is to make these data more accessible to people who want to write about, analyze, or use them in their work. You can email us at statetestscoreresults@gmail.com or leave a comment below.