Welcome!
Today we’re releasing the first set of 2023 state-level school assessment data, from Indiana and Tennessee. This newsletter will come out every time new state data are released.
As we discussed in our introductory post (read it here), our goal in these posts is to provide a top-line summary of the state-level assessment results. We’re focusing on ELA (English language arts) and math scores for grades 3 through 8, and we’ll provide the same three graphs for each state:
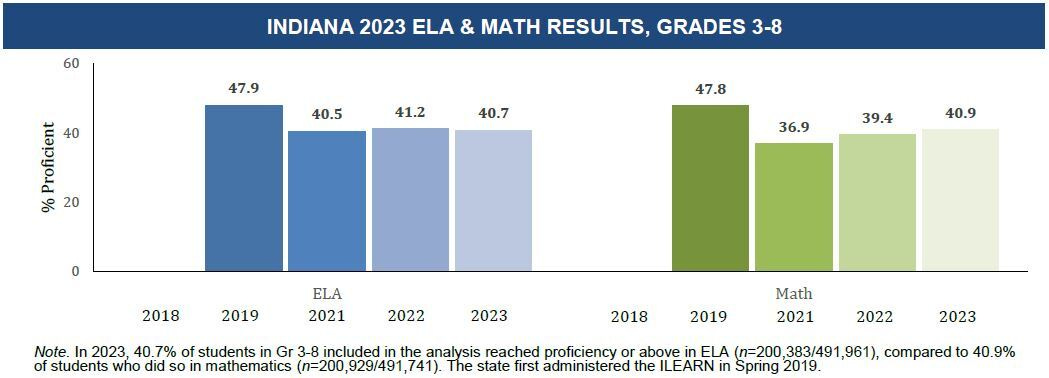
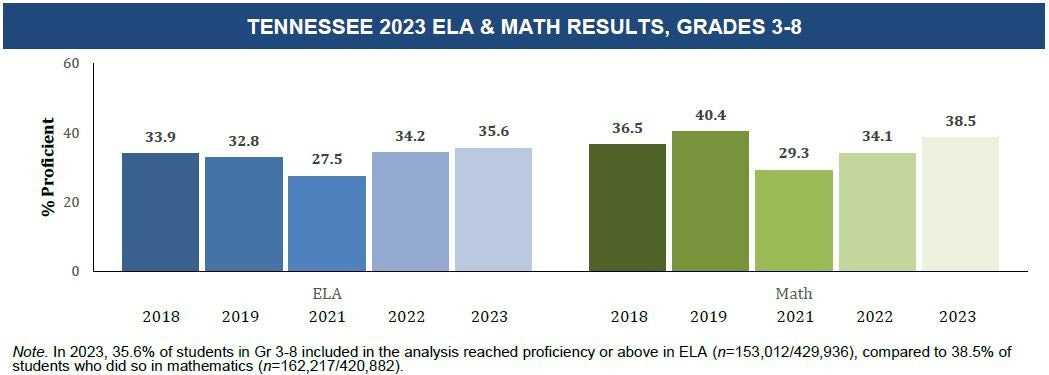
Overall proficiency rates in ELA and math, going back to 2018 if possible
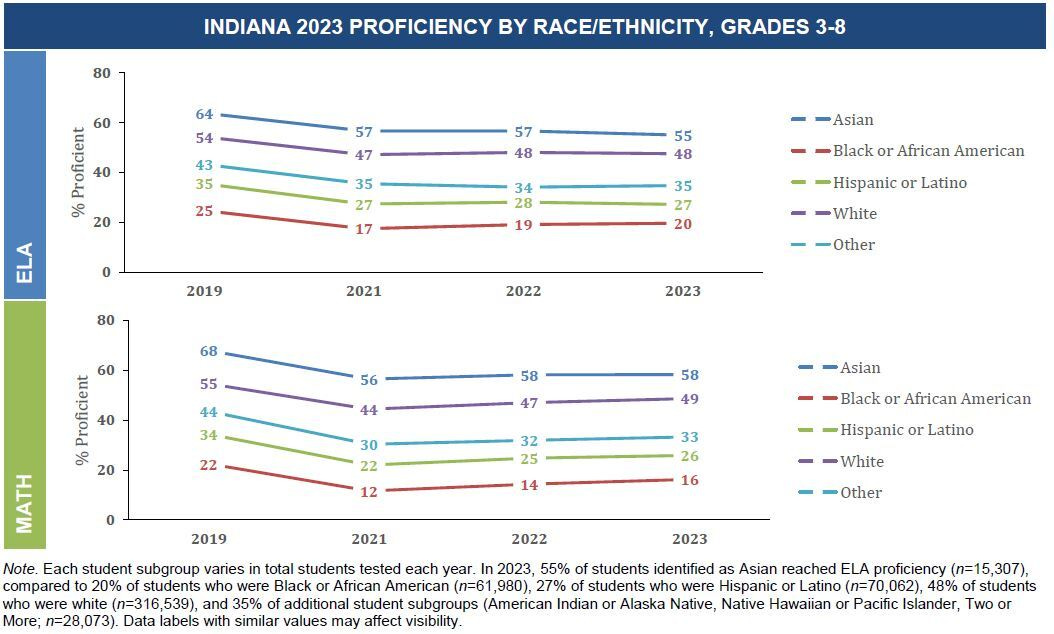
Proficiency rates in ELA and math by race/ethnicity
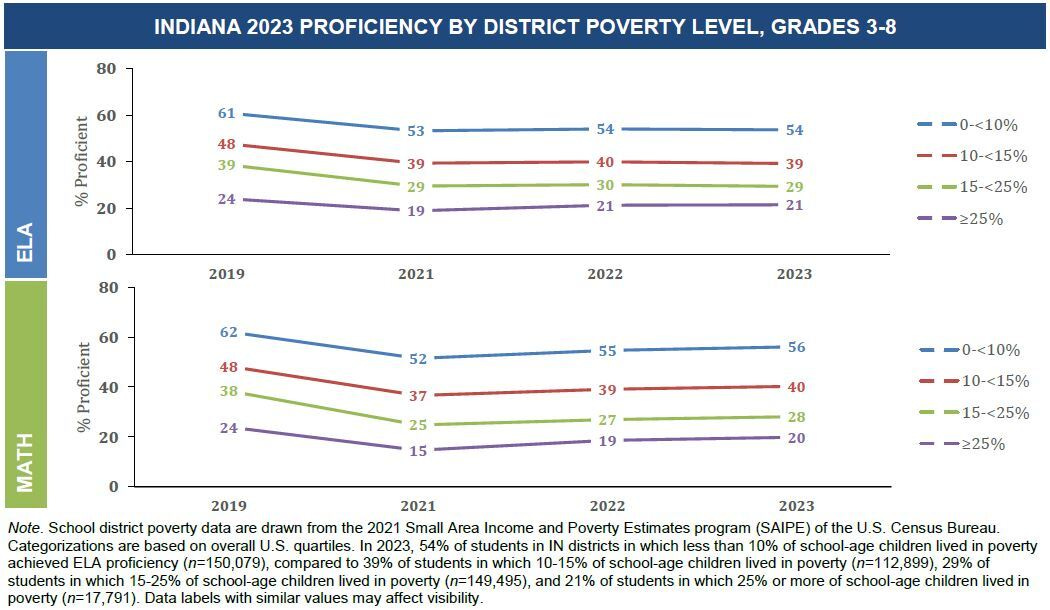
Proficiency rates in ELA and math by district-level poverty rate
If you are interested in other information out of these data — other analyses, data cuts, or visualizations — please reach out and we’ll see if we can help. We’ve only scratched the surface here, and a main goal of our work is to make these data more accessible to people who want to write about, analyze, or use them in their work.
If you are interested in a PDF version of these graphs in a two-page memo, here they are.
Indiana
The student outcome data used in this Data Brief come from the Indiana Learning Evaluation Assessment Readiness Network (ILEARN) assessment; more information can be found here. The ILEARN includes four proficiency levels: Below Proficiency, Approaching Proficiency, At Proficiency, and Above Proficiency. In the summaries below we define proficiency as students who were the top two categories.
Indiana introduced the ILEARN assessment in 2019, so prior years of data are not comparable. Indiana did not assess students in 2020 due to the pandemic.
Overall Trends
Overall proficiency in Indiana fell in both ELA and math between 2019 and 2021, during the COVID-19 pandemic. Proficiency rates fell about 8 percentage points in ELA and 11 percentage points in math.
Between 2021 and 2023, there has been minimal recovery in proficiency rates in ELA; the 2023 rates are below 2022, and comparable to 2021. Math proficiency rates have improved 4 percentage points since 2021 but remain about 7 percentage points below their 2019 pre-pandemic levels.
Trends by Race and Ethnicity
There are very stark differences in proficiency levels across race/ethnicity student subgroups in both ELA and math in the Indiana data. Black and Hispanic students perform worse than other subgroups, and Asian students, on average, have higher proficiency rates in both subject areas.
All groups had similarly-sized declines during the pandemic from 2019 to 2021, and similarly limited recovery. Groups that had higher scores to begin with still have higher scores, but have not made up more ground.
Trends by District-Level Income
Districts are divided into groups based on the share of students in poverty, as classified by the U.S. Census Bureau in their 2021 Small Area Income and Poverty Estimates program (SAIPE). All groups showed declines in proficiency during the pandemic, and limited recovery.
Somewhat encouragingly, the highest-poverty districts show the largest share of losses recovered between 2021 and 2023. These districts also have substantially lower proficiency rates pre-pandemic.
Summary
Assessment data in Indiana shows little sign of robust recovery from the large declines in proficiency rates during the COVID-19 pandemic.
Tennessee
The student outcome data come from Tennessee’s TNReady assessment as part of the Tennessee Comprehensive Assessment Program; more information can be found here. There are four proficiency levels: Below Expectations, Approaching Expectations, Met Expectations, and Exceeded Expectations. Proficiency as defined here as the share of students who met or exceeded expectations.
Tennessee did not assess students in 2020 due to the pandemic.
Overall Trends
Overall proficiency in Tennessee fell in both ELA and math between 2019 and 2021, during the COVID-19 pandemic. Proficiency rates fell about 5 percentage points in ELA and 11 percentage points in math.
Between 2021 and 2022, Tennessee showed considerable overall recovery, fully making up losses in ELA and making up significant ground in math. Between 2022 and 2023, both proficiency rates continued to rise, with ELA proficiency rates now exceeding 2019 and math rates nearly fully recovered.
Trends by Race and Ethnicity
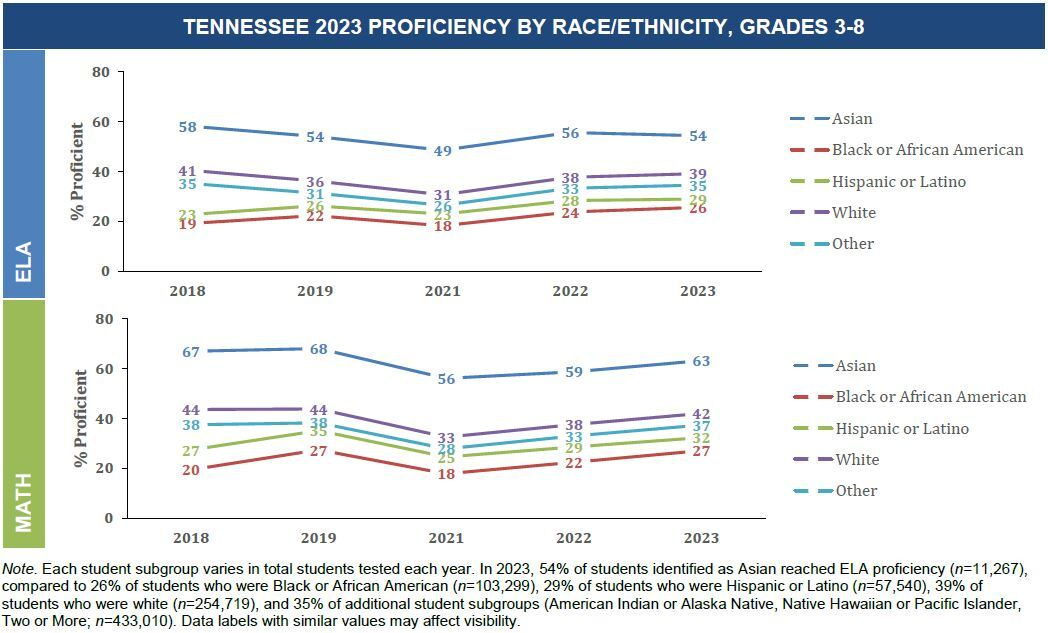
As with Indiana, there are very stark differences in proficiency levels across race/ethnicity subgroups in both ELA and math in the Tennessee data. Black and Hispanic students perform worse than other subgroups, and Asian students, on average, have higher proficiency rates in both subject areas.
All groups had similarly-sized declines during the pandemic from 2019 to 2021, and have shown similar recovery rates. Black and Hispanic students, who had lower scores in the pre-pandemic period, are back to these proficiency levels in math, and above them in ELA.
Trends by District-Level Income
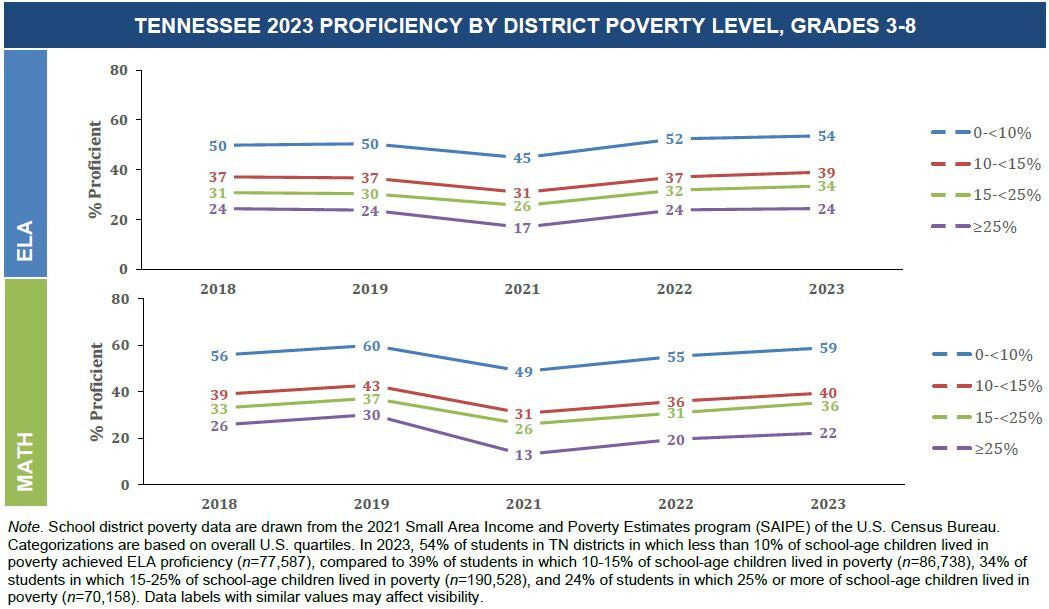
Districts are divided into groups based on the share of students in poverty, as classified by the U.S. Census Bureau in their 2021 Small Area Income and Poverty Estimates program (SAIPE). All groups show recovery post-pandemic.
The pandemic has widened the already large gap between the highest- and lowest-income districts. Districts with the largest share of students in poverty (>25% of the school-aged population) had the largest declines in proficiency between 2019 and 2021, and they have not seen the same extent of recovery as higher-income districts. For example, in math, the lowest-poverty districts had proficiency rates 30 percentage points above the highest-poverty districts in 2019. By 2023, that had grown to 37 percentage points. Although all districts have made progress since the pandemic, there is more work to do.
Summary
In contrast to Indiana, Tennessee had a robust post-COVID recovery and has continued to make gains in their ELA and math proficiency.
If you found this summary useful, please subscribe or share this! More data to come. You can reach us by email at covid19schooldatahub@gmail.com


