


Louisiana

Brief recap: Here at the State Assessment Data Substack, we’ll be releasing these posts as states release their data (and we clean it). Every post will have three sets of graphs: 1) math and ELA test scores for grades 3-8 over time, 2) math and ELA scores by race/ethnicity, and 3) outcomes by economic status, when possible.
Our intention here is to give you the big picture: where are the state scores going, and how does that differ by group.
These graphs are made with Zelma.ai, and if you want to explore up through the 2023 data yourself, you can do that here. Have questions? You can read more about Zelma in our last post here or you can email us at statetestscoreresults@gmail.com.
Today: Louisiana.
State Assessment Background
Louisiana’s student outcome data come from the “Louisiana Educational Assessment Program (LEAP) 2025.” The data represent outcomes for students in Grades 3–8 in math and ELA. The results below reflect student outcomes between 2015-2024.
Overall Trends
The overall proficiency rate for students in Louisiana either improved slightly or did not change between 2023 and 2024 for ELA or math for students in grades 3–8. ELA scores improved about 1 percentage point (up from 42% to 43% proficient), not quite reaching 2019 rates of 44%. Math proficiency rates did not change from 2023, remaining at 31%, which is below the pre-pandemic (2019) rate of 34%.
Overall ELA & Math Results, Grades 3–8

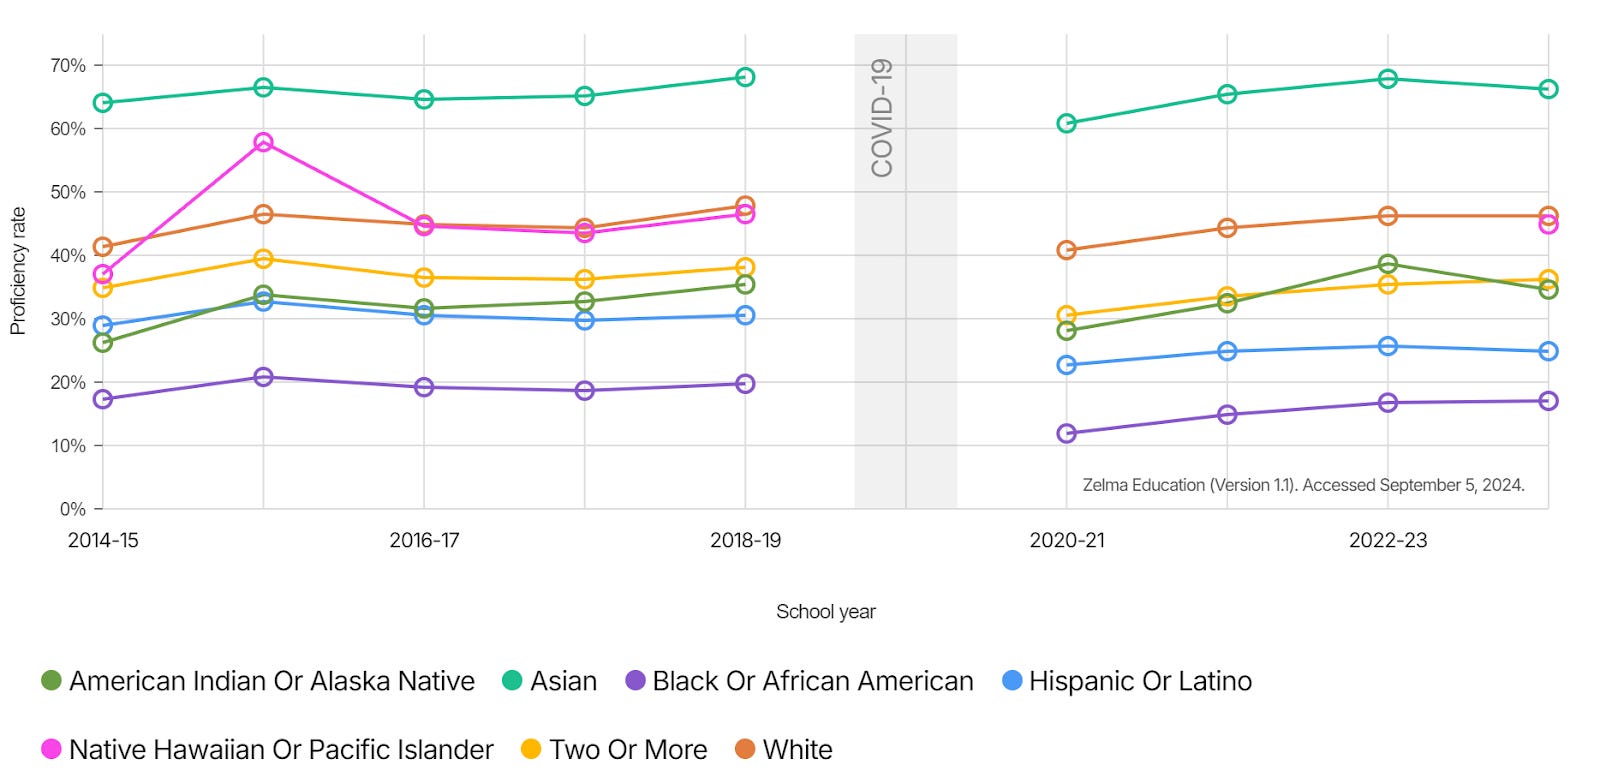
Trends by Race and Ethnicity
ELA Results by Race/Ethnicity, Grades 3–8

Math Results by Race/Ethnicity, Grades 3–8
Trends by Economic Status
ELA Results by Economic Status, Grades 3–8

Math Results by Economic Status, Grades 3–8
