


North Carolina: 2024 Assessment Results
Math gains, but not yet at pre-pandemic levels

Overview
Here at the 2024 State Assessment Data Substack, we’re releasing these posts as states release their data (and we clean it). To keep it brief, every post will have three sets of graphs: 1) math and ELA test scores for grades 3-8 over time, 2) math and ELA scores by race/ethnicity, and 3) outcomes by economic status, when possible.
Our intention is to give you the big picture: where are the state scores going, and how that differs by student group. These graphs are made with Zelma.ai, and if you want to explore up through the 2023 data yourself, you can do that here. All available 2024 assessment data will be published in December. You can read more about Zelma in our post here.
Today: North Carolina.
State Assessment Background
North Carolina’s student outcome data come from North Carolina End-of-Grade (EOG) Tests between 2019-2024. Note that the state transitioned from the EOG - Edition 4 assessment to the next iteration, Edition 5, in 2019 for math and 2021 for ELA. We include 2019 ELA results in the figures below for context.
Overall Trends
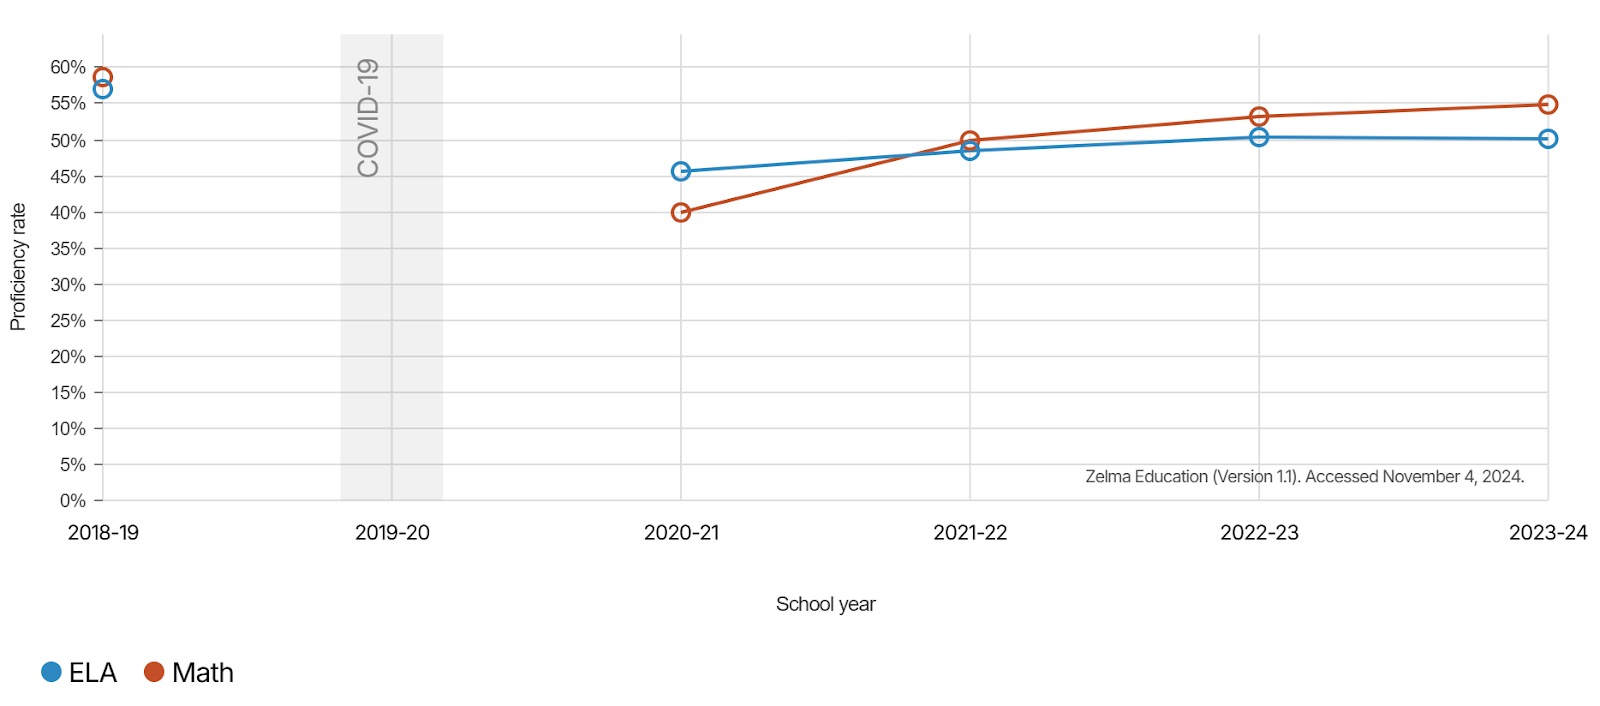
North Carolina’s overall proficiency rates in 2024 for students in grades 3–8 rose in math compared to 2023, while remaining largely unchanged in ELA (digging into grade-level data, most grades remained unchanged or rose slightly except for drops in Grades 4 and 7 in ELA). Proficiency in both subject areas remains below pre-pandemic levels.
ELA: Proficiency rates remained at around 50% in 2023 and 2024, rising from 46% in 2021.
Math: Proficiency rates rose from about 53% to 55% between 2023 and 2024, short of pre-pandemic rates of 59% in 2019.
Overall ELA & Math Results, Grades 3–8
Trends by Race and Ethnicity
ELA Results by Race/Ethnicity, Grades 3–8
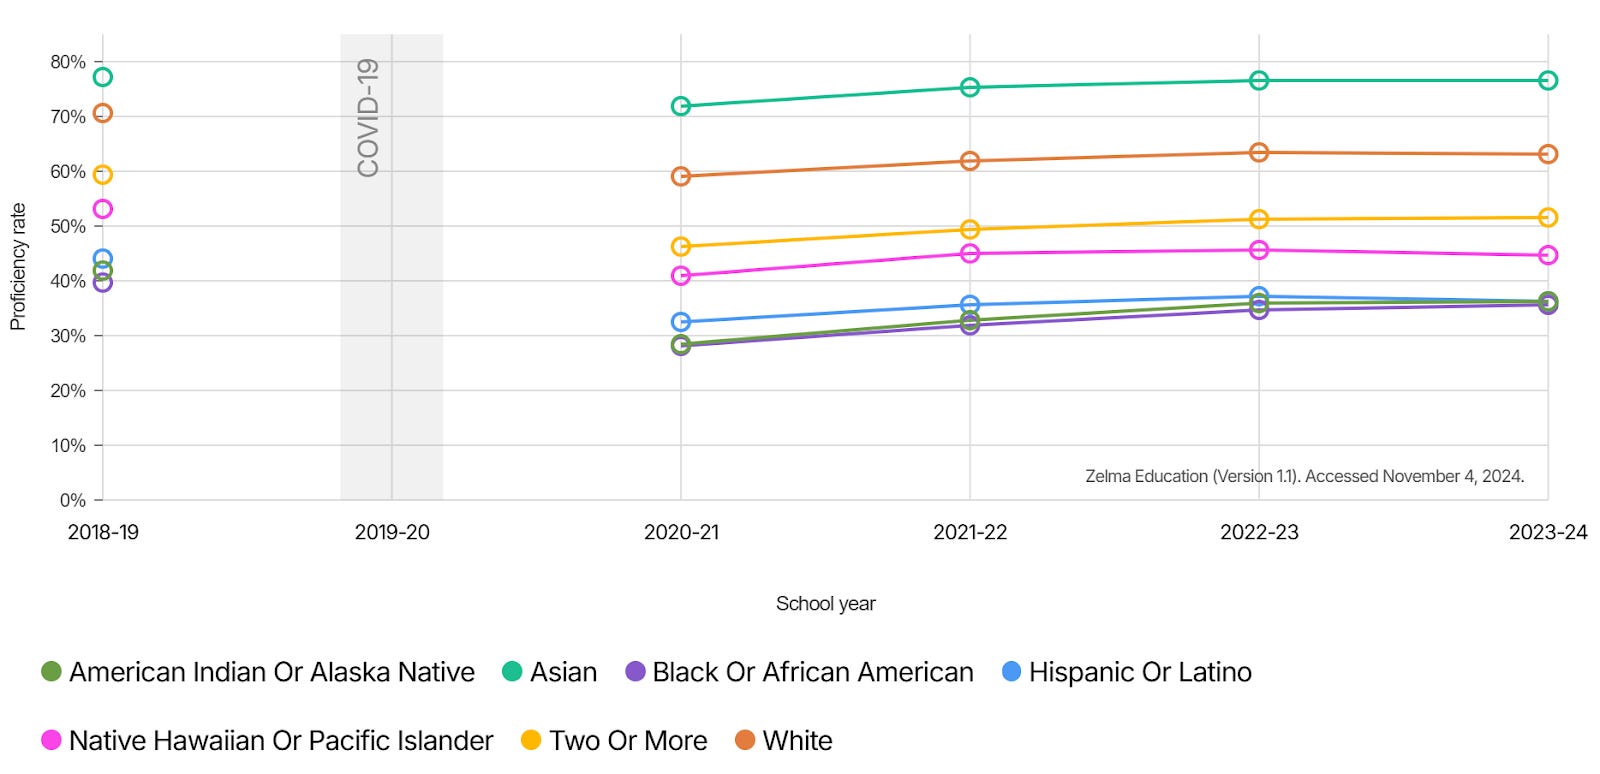
Math Results by Race/Ethnicity, Grades 3–8

Trends by Economic Status
ELA Results by Economic Status, Grades 3–8

Math Results by Economic Status, Grades 3–8
