Oregon: 2024 Assessment Results
Minimal change between 2023 and 2024; large differences by demographics

Overview
Here at the 2024 State Assessment Data Substack, we’re releasing these posts as states release their data (and we clean it). To keep it brief, every post will have three sets of graphs: 1) math and ELA test scores for grades 3-8 over time, 2) math and ELA scores by race/ethnicity, and 3) outcomes by economic status, when possible.
Our intention is to give you the big picture: where are the state scores going, and how that differs by student group. These graphs are made with Zelma.ai, and if you want to explore up through the 2023 data yourself, you can do that here. All available 2024 assessment data will be published in December. You can read more about Zelma in our post here.
Today: Oregon.
State Assessment Background
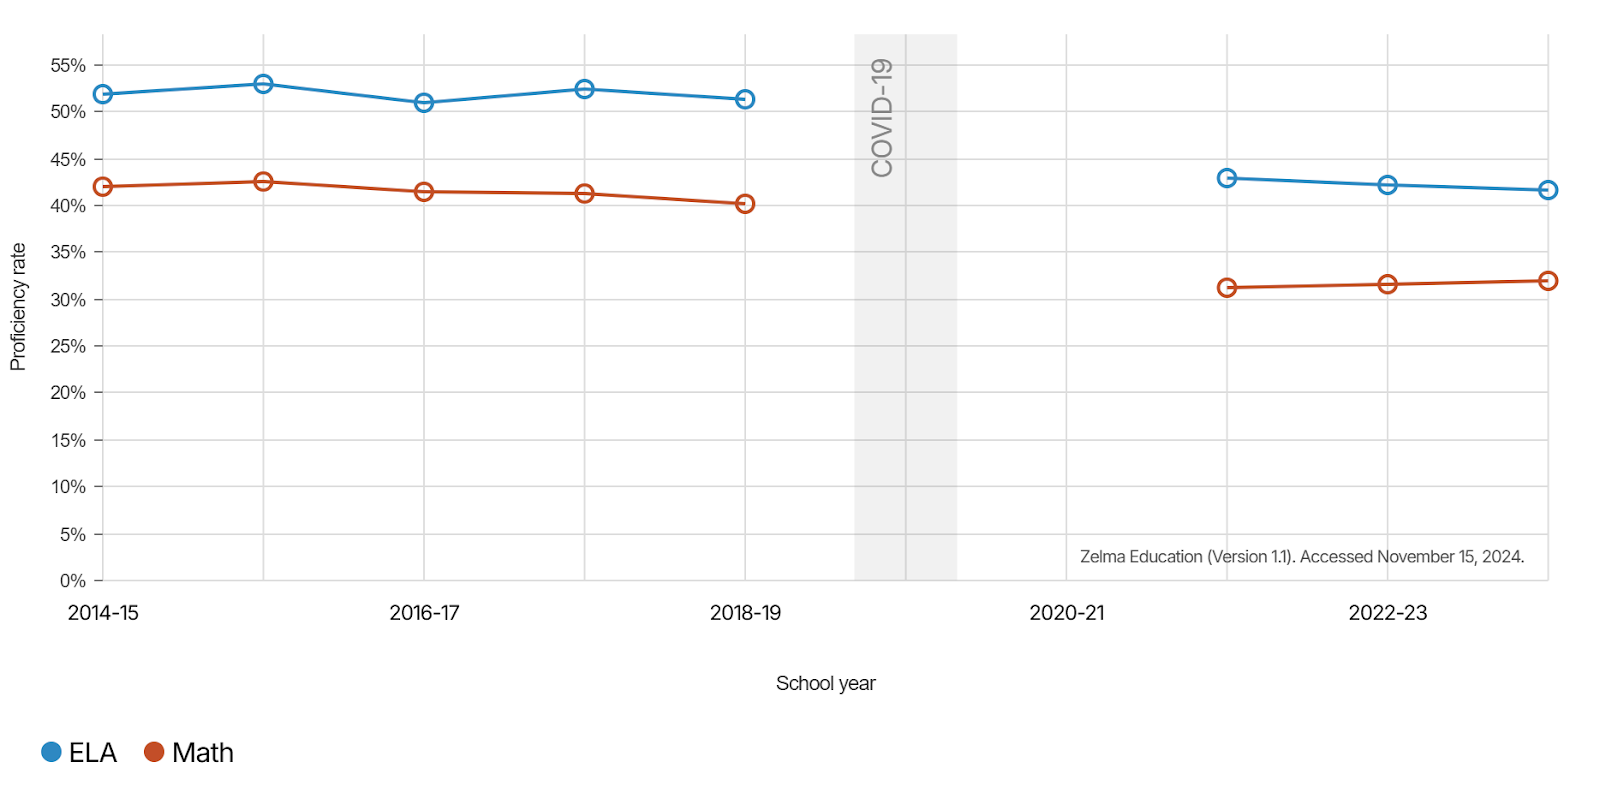
Oregon’s student outcome data come from the state’s Smarter Balanced Assessments. The results below reflect student proficiency levels in grades 3–8 in math and ELA between 2015-2024.
A few notes about the Oregon data:
Data for the 2020-21 school year are not included here due to low statewide student participation rates (below 40%).
Although federal law requires participation in the state assessments from at least 95% of students, Oregon’s participation rates are typically lower. In 2024, overall participation rates by grade between grades 3-8 varied between 88.1% and 93.9%.
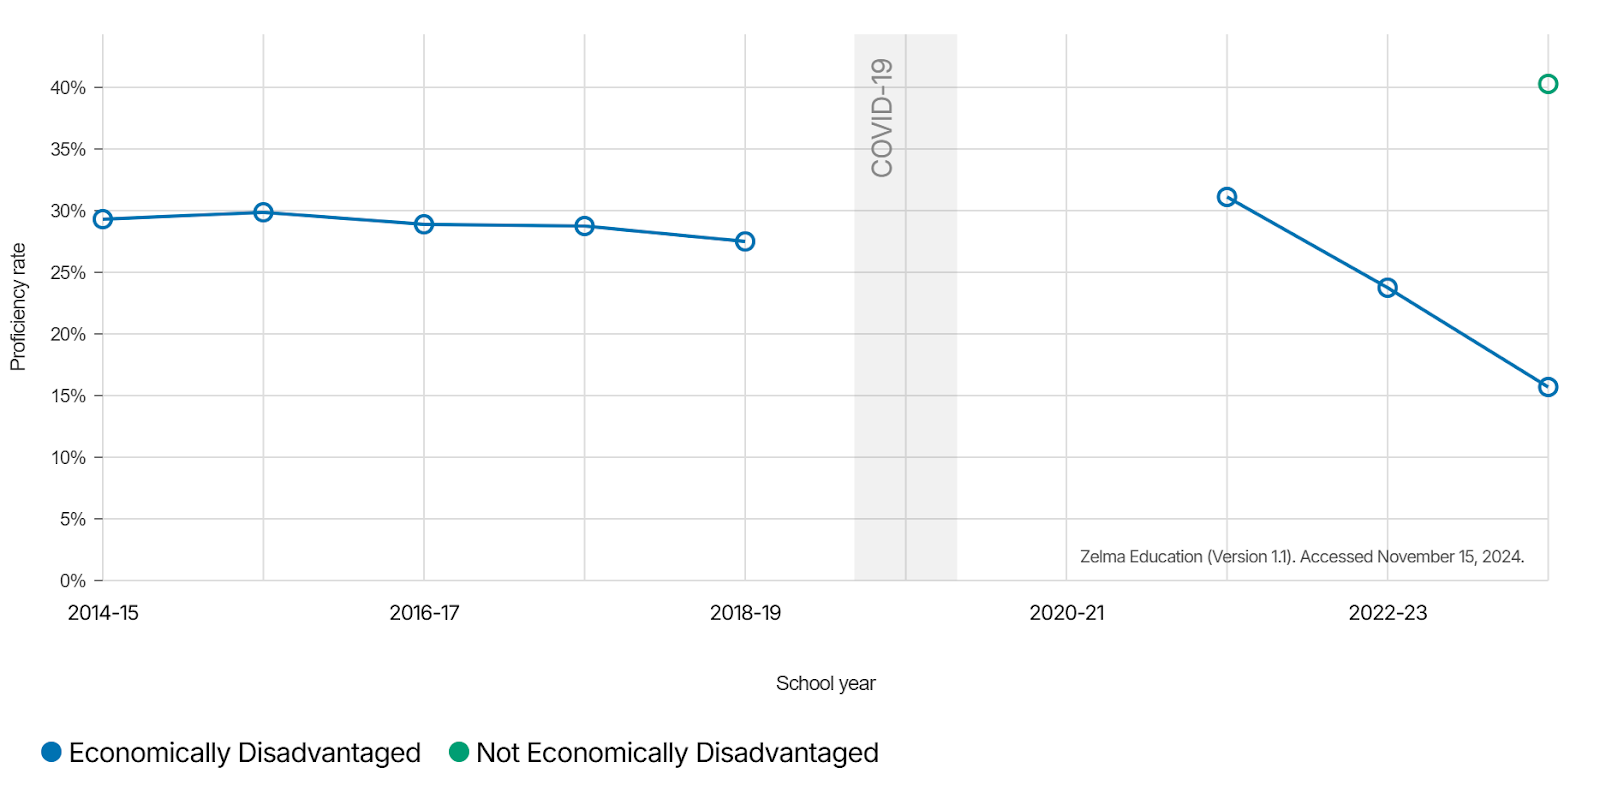
The “not economically disadvantaged” student subgroup was newly added in 2024, so we unfortunately do not have prior years of comparison for that data point.
Overall Trends
Oregon’s overall proficiency rates for students in grades 3–8 did not change significantly between 2023 and 2024 in either ELA or math (this does not necessarily reflect individual grade-level trends). Proficiency in both subject areas remains below pre-pandemic levels.
ELA: Proficiency rates remained around 42% in both 2023 and 2024, down from around 51% in 2019.
Math: Proficiency rates remained around 32% in both 2023 and 2024, short of pre-pandemic rates of 40% in 2019.
Overall ELA & Math Results, Grades 3–8
Trends by Race and Ethnicity
ELA Results by Race/Ethnicity, Grades 3–8
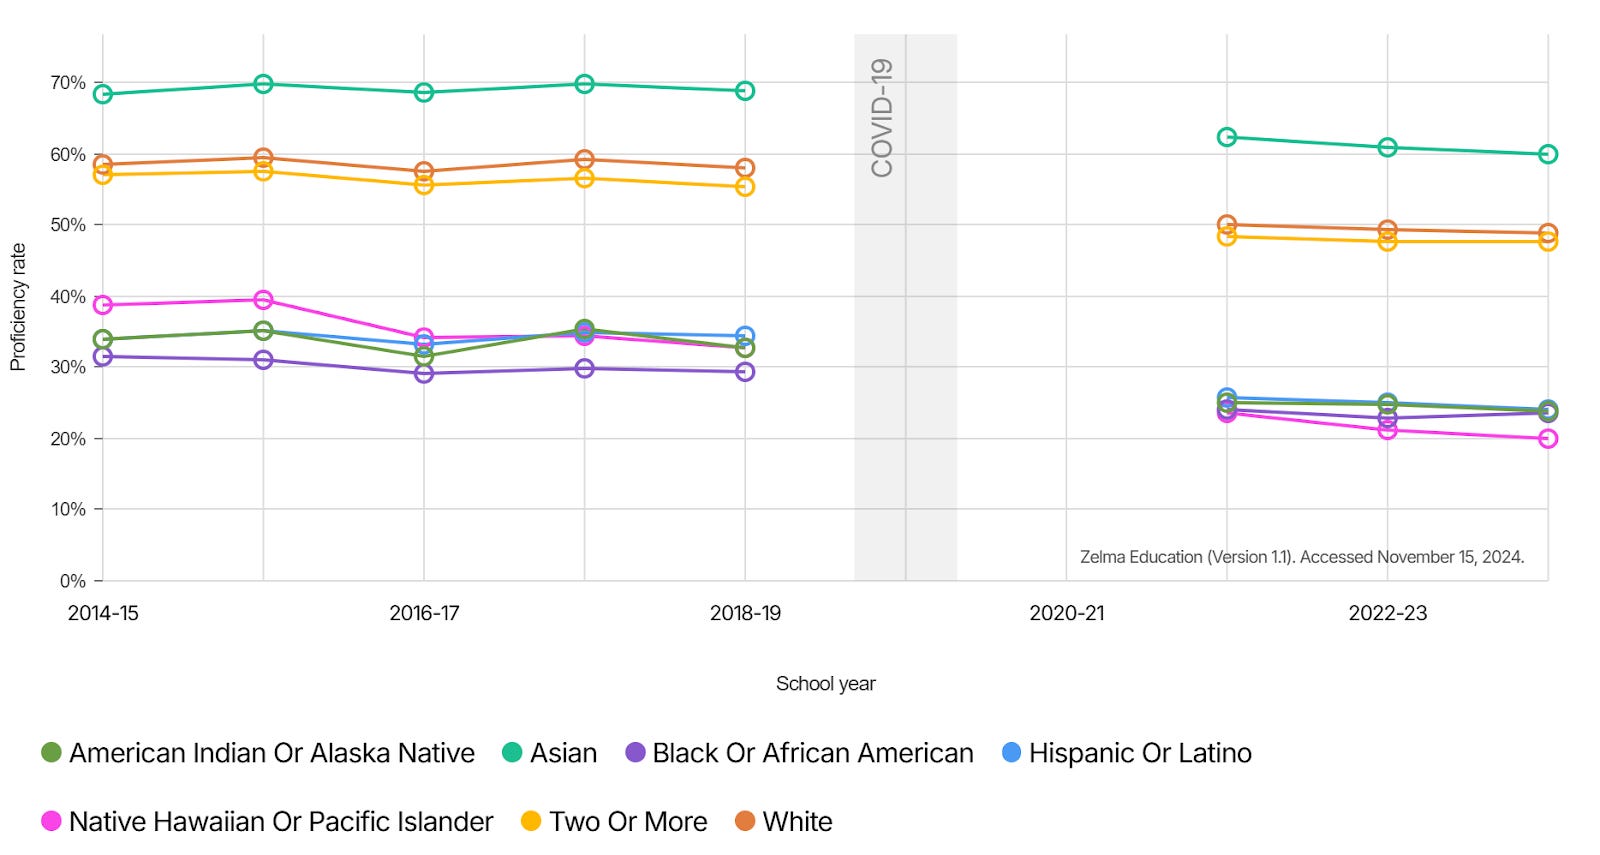
Math Results by Race/Ethnicity, Grades 3–8

Trends by Economic Status
ELA Results by Economic Status, Grades 3–8

Math Results by Economic Status, Grades 3–8