South Dakota: 2024 Assessment Results
Gains in ELA and math; not yet at pre-pandemic levels

Overview
Here at the 2024 State Assessment Data Substack, we’re releasing these posts as states release their data (and we clean it). To keep it brief, every post will have three sets of graphs: 1) math and ELA test scores for grades 3-8 over time, 2) math and ELA scores by race/ethnicity, and 3) outcomes by economic status, when possible.
Our intention is to give you the big picture: where are the state scores going, and how that differs by student group. These graphs are made with Zelma.ai, and if you want to explore up through the 2023 data yourself, you can do that here. All available 2024 assessment data will be published later this month. You can read more about Zelma in our post here.
Today: South Dakota
State Assessment Background
South Dakota’s student outcome data come from the state’s Smarter Balanced assessment. The results below reflect student proficiency levels in grades 3–8 in math and ELA between 2015-2024. Note that these results are based on the number of tests that received a score; it does not include students who did not participate in the assessment or students that had an assessment that could not be scored.
Overall Trends
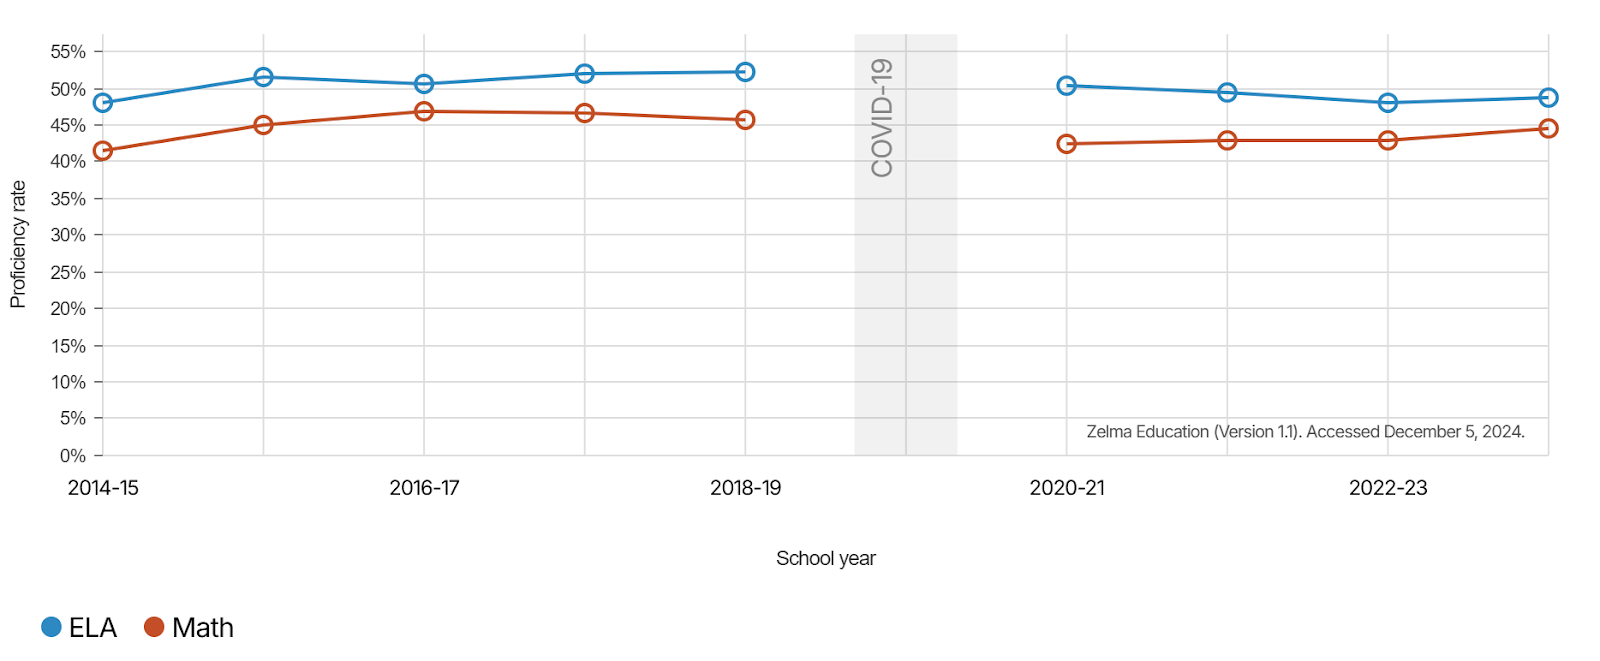
South Dakota’s overall proficiency rates for students in grades 3–8 rose slightly in both ELA and math between 2023 and 2024, though scores have not reached pre-pandemic proficiency levels in either subject.
ELA: Proficiency rates rose slightly from approximately 48% to 49% between 2023 and 2024, down from 52% in 2019.
Math: Proficiency rates rose slightly from 43% to 44% from 2023 to 2024, down from around 46% in 2019.
Overall ELA & Math Results, Grades 3–8
Trends by Race and Ethnicity
ELA Results by Race/Ethnicity, Grades 3–8

Math Results by Race/Ethnicity, Grades 3–8

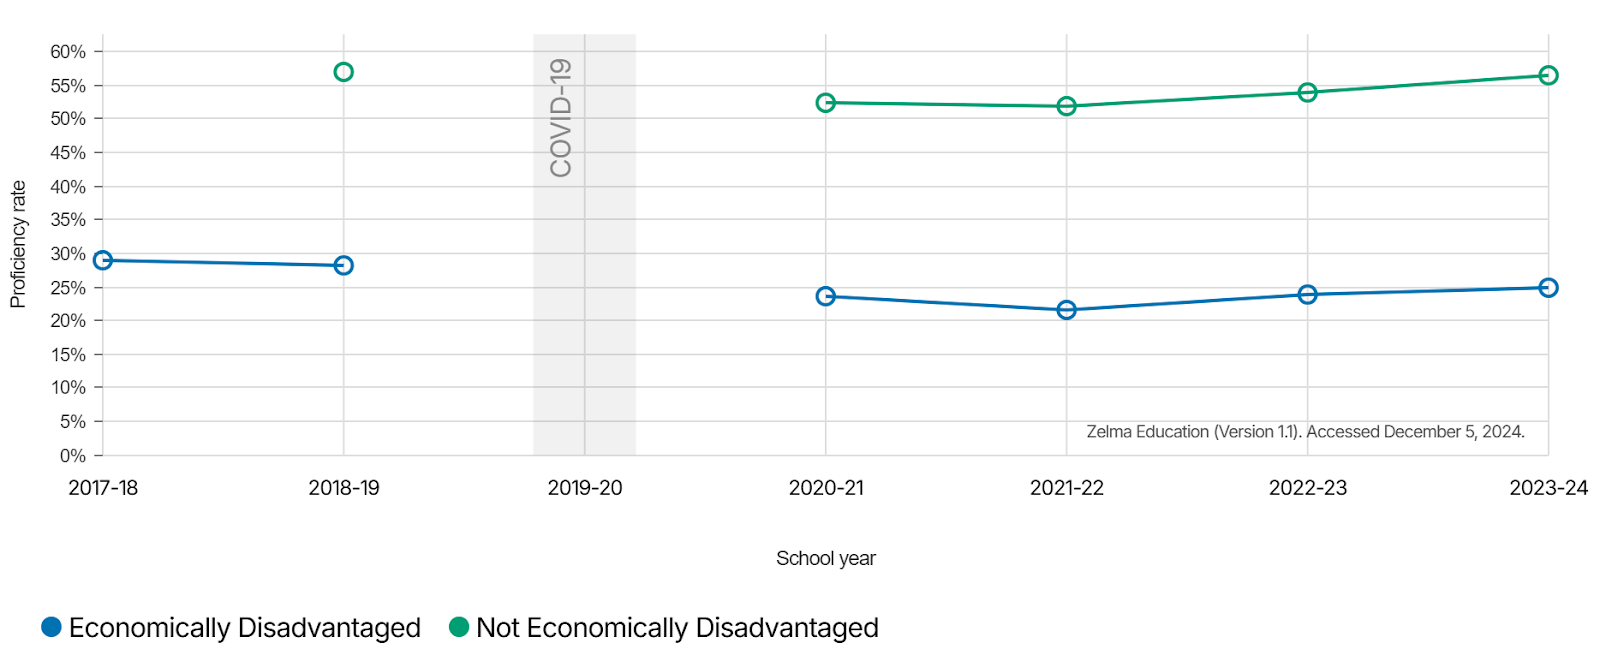
Trends by Economic Status
ELA Results by Economic Status, Grades 3–8

Math Results by Economic Status, Grades 3–8