Today’s edition of this newsletter reports on data from Delaware and West Virginia.
Prior posts:
At the end of today’s post, we provide a brief comparison of the states with data released thus far.
We will continue to post individual states as they are released; in addition, toward the end of August we’ll come out with a summary post giving an overall sense of where the data stands across states. At this point, we plan to merge these data with 2020-2021 school closures.
A Quick Recap
As we discussed in our introductory post (read it here), our goal in this project is to provide a top-line summary of the state-level assessment results. We’re focusing on ELA (English language arts) and math scores for grades 3 through 8, and we’ll provide the same three graphs for each state:
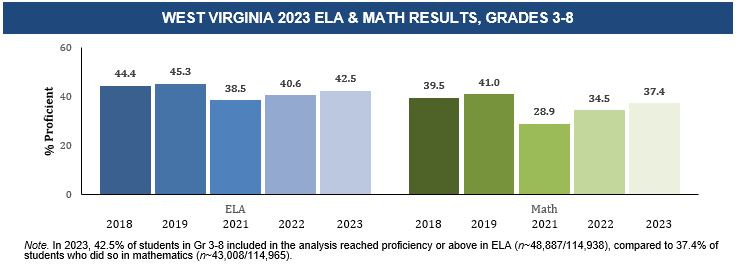
Overall proficiency rates in ELA and math, going back to 2018 if possible
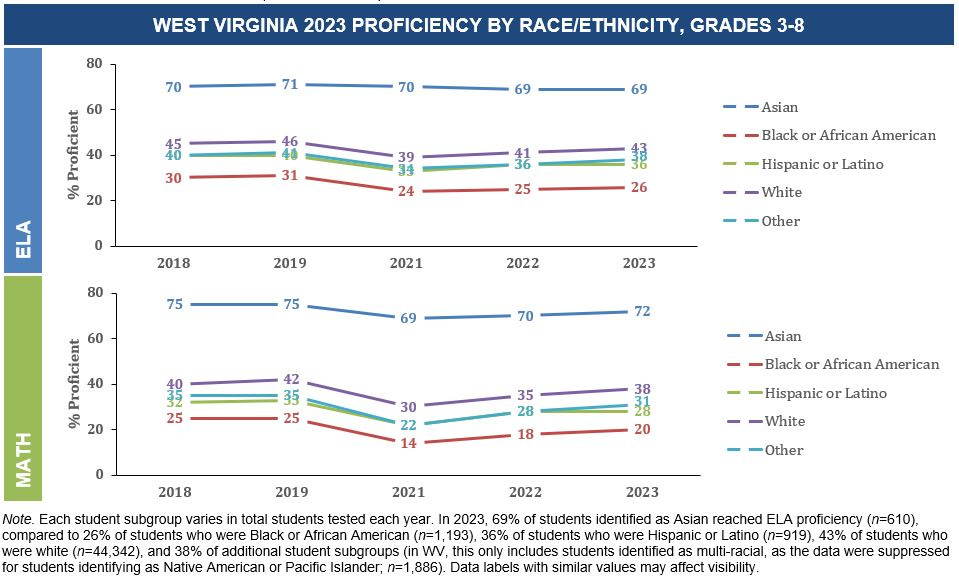
Proficiency rates in ELA and math by race/ethnicity
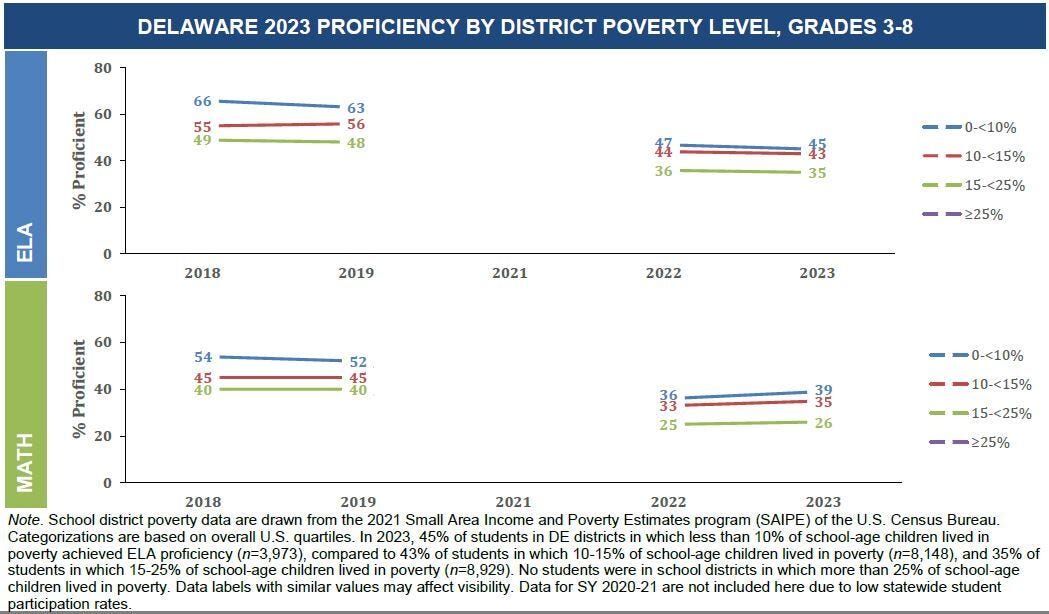
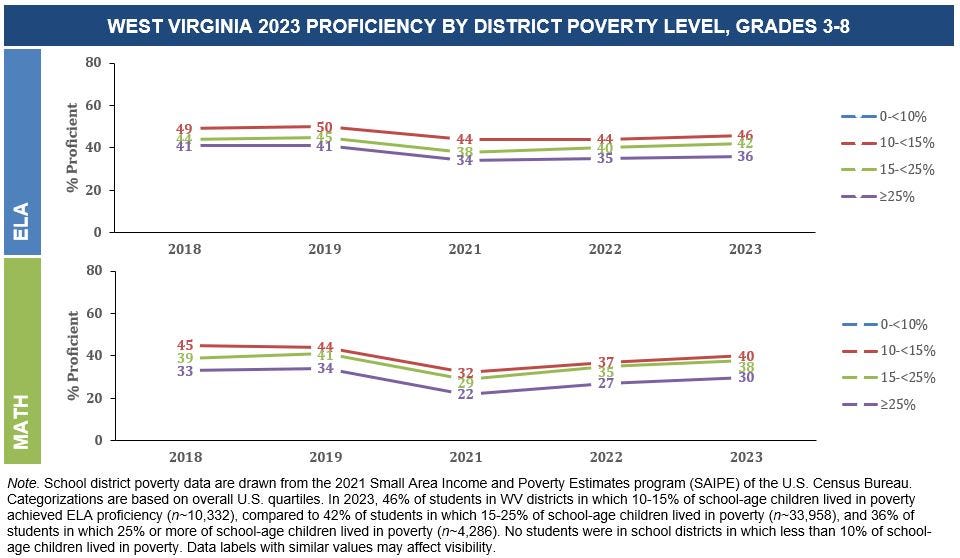
Proficiency rates in ELA and math by district-level poverty rate
If you are interested in other information out of these data — other analyses, data cuts, or visualizations — please reach out and we’ll see if we can help. We’ve only scratched the surface here, and a main goal of our work is to make these data more accessible to people who want to write about, analyze, or use them in their work. You can email us at statetestscoreresults@gmail.com.
Delaware
The student outcome data used in this data brief come from Delaware’s Smarter Balanced Summative Assessments; more information can be found here. These assessments include four proficiency levels: Does Not Meet Standards, Nearly Meets Standards, Meets Standards, and Exceeds Standards. In the summaries below, we define proficiency as students who were in the top two categories.
Delaware did not assess students in 2020 due to the pandemic. In addition, in the spring of 2021 the participation rates for testing in Delaware were extremely low. As a result, we are not reporting these data, as they are not comparable or representative. Therefore, the first “post-COVID” testing year is 2022 and the first opportunity to observe recovery is 2023.
Overall Trends
Overall proficiency in Delaware fell in both ELA and math between 2019 and 2022, during the COVID-19 pandemic. Proficiency rates fell about 11.6 percentage points in ELA and 13.9 percentage points in math. These are among the larger losses across U.S. states.
Recovery from 2022 to 2023 has been extremely limited; ELA scores declined further from 2022 to 2023, and math scores recovered only slightly. Because of the missing data in 2021, it is not possible to evaluate whether there was any initial recovery in the post-pandemic year. However, scores in 2023 remain far below where they were in 2019.
Trends by Race and Ethnicity
There are very stark differences in proficiency levels across race/ethnicity student subgroups in both ELA and math. Black and Hispanic students perform worse than other subgroups, and Asian students, on average, have higher proficiency rates in both subject areas.
Asian students in Delaware are the only racial group that saw test score gains in ELA from 2022 to 2023. All groups showed small gains in math but remain far below baseline. Only 16% of Black students statewide tested proficient in math in 2023. This is in comparison to 72% of Asian students, one of the larger racial score gaps across states.
Trends by District-Level Income
Districts are divided into groups based on the share of students in poverty, as classified by the U.S. Census Bureau in their 2021 Small Area Income and Poverty Estimates program (SAIPE). All groups showed declines in proficiency during the pandemic, and limited recovery.
As is commonly true across state assessment data, lower-poverty school districts have higher proficiency rates. In Delaware, the declines during the pandemic are similar across district poverty levels, and lack of recovery is also similar.
Note that in Delaware there are no school districts with more than 25% of households below the federal poverty line.
West Virginia
The student outcome data used in this data brief come from West Virginia’s General Summative Assessment (WVGSA); more information can be found here. These assessments include four proficiency levels: Does Not Meet Standard, Partially Meets Standard, Meets Standard, and Exceeds Standard. In the summaries below, we define proficiency as students who were in the top two categories.
As with other states, West Virginia did not assess students in 2020 due to the pandemic.
The West Virginia Department of Education reports that as of 2023, it has started both literacy and math programs to help support student learning. This includes “Ready, Read, Write, West Virginia,” a literacy campaign based in the science of reading, and the UNITe with Numeracy program, which focuses on building math proficiency.
Overall Trends
Overall proficiency in West Virginia fell in both ELA and math between 2019 and 2021, during the COVID-19 pandemic. Proficiency rates fell about 6.8 percentage points in ELA and 12.1 percentage points in math.
Test scores showed some recovery signs from 2021 to 2022, and the recovery rates continued at a similar pace in 2023. Notably, math recovery has been especially strong: math test scores have gained 8.5 percentage points from 2021 to 2023. Both math and ELA scores remain behind 2019 levels but are on pace to recover more fully by 2024.
Trends by Race and Ethnicity
There are very stark differences in proficiency levels across race/ethnicity student subgroups in both ELA and math in Delaware. Black and Hispanic students perform worse than other subgroups, and Asian students, on average, have higher proficiency rates in both subject areas.
Asian students in West Virginia stand out in both overall levels and in experiencing relatively limited declines in test scores over the pandemic. All other racial groups have similar-size declines and recovery.
Trends by District-Level Income
Districts are divided into groups based on the share of students in poverty, as classified by the U.S. Census Bureau in their 2021 Small Area Income and Poverty Estimates program (SAIPE). All groups showed declines in proficiency during the pandemic, and limited recovery.
As is commonly true across state assessment data, lower-poverty school districts have higher proficiency rates. In West Virginia, as in Delaware, the declines during the pandemic are similar across district poverty levels, and lack of recovery is also similar.
Note that in West Virginia, there are no school districts with fewer than 10% of households below the federal poverty line.
Summary
Within these two states, West Virginia is on a more promising recovery path than Delaware.
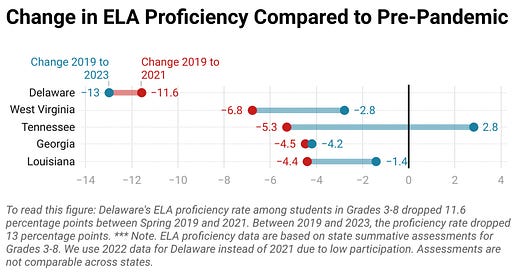
Looking at the data we have released thus far, the graphs below show, for ELA and math, the changes between 2019 and the first pre-pandemic year (either 2021 or, for Delaware, 2022) and then the changes between 2019 and 2023.
The graphs illustrate the very significant variation in pandemic recovery across states. Tennessee and West Virginia stand out with the largest recovery. Louisiana is recovering, but more moderately. Georgia and Delaware have shown much more modest progress.
What else would you like to see in these data? Leave a comment, or email us at statetestscoreresults@gmail.com.





Great stuff. Question - have any of these states changed their proficiency cutoff scores?
I hope a summary report with this info merged with closure times can be sent to Congress and possibly local govts. They need to know the impact of the closures and to see that states with sooner openings did better so they can stop blaming the pandemic itself and lay them blame where it belongs - on the closures.