Today’s edition of this newsletter reports on data from Georgia, released this morning (7/31). This is our second post highlighting the release of state assessment data, following Tennessee and Indiana.
A Quick Recap
As we discussed in our introductory post (read it here), our goal in this project is to provide a top-line summary of the state-level assessment results. We’re focusing on ELA (English language arts) and math scores for grades 3 through 8, and we’ll provide the same three graphs for each state:
Overall proficiency rates in ELA and math, going back to 2018 if possible
Proficiency rates in ELA and math by race/ethnicity
Proficiency rates in ELA and math by district-level poverty rate
If you are interested in other information out of these data — other analyses, data cuts, or visualizations — please reach out and we’ll see if we can help. We’ve only scratched the surface here, and a main goal of our work is to make these data more accessible to people who want to write about, analyze, or use them in their work. You can email us at statetestscoreresults@gmail.com.
If you are interested in a PDF version of the graphs in a two-page memo, here itis:
Georgia Testing Overview
The student outcome data used in this data brief come from the Georgia Milestones End-of-Grade (EOG) Assessments; more information can be found here. The EOG Assessments include four proficiency levels: Beginning Learners, Developing Learners, Proficient Learners, and Distinguished Learners. In the summaries below, we define proficiency as students who were in the top two categories. Georgia did not assess students in 2020 due to the pandemic.
Overall Trends
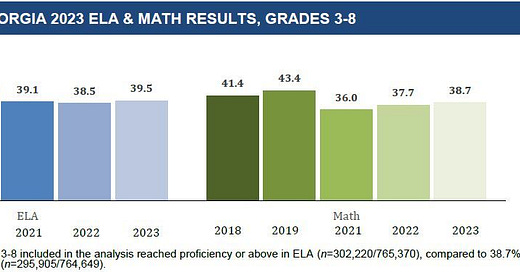
Overall proficiency in Georgia fell in both ELA and math between 2019 and 2021, during the COVID-19 pandemic. Proficiency rates fell about 4.5 percentage points in ELA and 7.5 percentage points in math. These losses were more modest than in many states.
State test scores in Georgia showed limited recovery between 2021 and 2022 and similarly limited recovery to 2023. Math test scores remain 4.7 percentage points lower than in 2019, and ELA scores 4.1 percentage points lower.
Trends by Race and Ethnicity
In general in these newsletters, we will aim to present data by race and ethnicity. However, Georgia has not released any demographic breakdowns of their state test scores and has indicated they do not plan to do so until December. Therefore, we are unable to provide any racial or ethnic breakdowns in the 2023 data.
Trends by District-Level Income
Districts are divided into groups based on the share of students in poverty, as classified by the U.S. Census Bureau in their 2021 Small Area Income and Poverty Estimates program (SAIPE). All groups showed declines in proficiency during the pandemic, and limited recovery.
As is commonly true across state assessment data, lower-poverty school districts have higher proficiency rates. In Georgia, the declines during the pandemic are similar across district poverty levels, and recovery is also similar.
Proficiency levels are, in general, low and concerning. In 2023, in districts with poverty rates over 25%, only 25% of students are testing at a proficiency level in math, and 27% in ELA. Put differently, three-quarters of students in grades 3-8 in these higher-poverty schools are not testing proficient for their grade level.
Summary
Assessment data in Georgia show only modest recovery from declines in proficiency rates during the COVID-19 pandemic.
What else would you like to see in these data? Leave a comment, or email us at statetestscoreresults@gmail.com.


As mentioned before, this data is incredible and incredibly important! But, it should carry with it a section on that state’s COVID policies regarding school closures (and possibly, policies regarding how books are removed from classrooms).